

Question: Using the Balance Sheet and Income Statement information given, what are the amounts in tan for this company? Ratio Assignment Instructions: Using the Balance Sheet
Using the Balance Sheet and Income Statement information given, what are the amounts in tan for this company?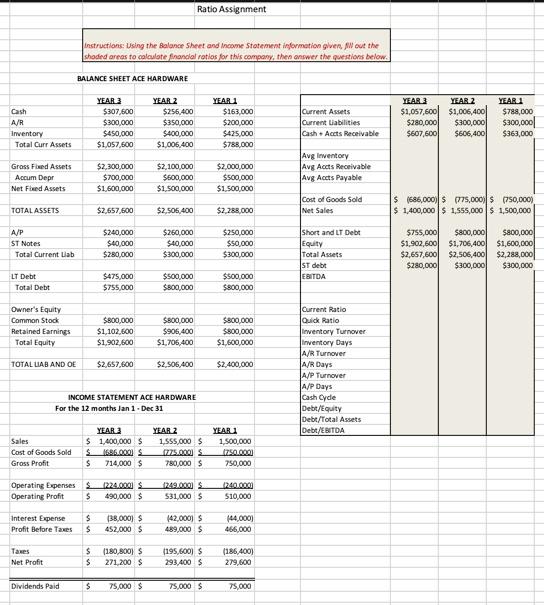
Ratio Assignment Instructions: Using the Balance Sheet and Income Statement information given, Wout the shaded areas to calculate finondal ratios for this company, the answer the questions below. BALANCE SHEET ACE HARDWARE Cash A/R Inventory Total Curr Assets YEAR 3 $307,600 $300,000 $450,000 $1,057,500 YEAR 2 $256.400 $350,000 $400,000 $1,006,400 YEAR 1 $163,000 $200.000 $425.000 $788,000 Current Assets Current Liabilities Cash.Acets Receivable YEAR 3 YEAR 2 $1,057,600 $1,006,400 $280,000 $300,000 $607,600 $606,400 YEARU $788,000 $300,000 $363,000 Grass Feed Assets Accum Depr Net Fred Assets $2,300,000 $700,000 $1,600,000 $2,100,000 $500,000 $1,500,000 $2,000,000 $500,000 $1.500,000 Avg Inventory Avg Acts Receivable Avg Acets Payable Cost of Goods Sold Net Sales $ 1686,000)| $ 75,000 $750,000) $ 1,400,000 $ 1,555,000 $ 1,500,000 TOTAL ASSETS $2,657,600 $2,506,400 $2.288,000 A/P ST Notes Total Current Lab $240,000 $40,000 $280,000 $260,000 $40.000 $300,000 $250,000 $50,000 $300,000 Short and LT Debt Equity Total Assets ST debt EBITDA $755,000 $800,000 $800,000 $1,902,600 $1,706,400 $1,600,000 $2,657,600 $2,506,400 $2,288,000 $280,000 $300,000 $300,000 LT Debt Total Debt $475,000 $755,000 $500,000 $800,000 $500,000 $800,000 Owner's Equity Common Stock Retained Earnings Total Equity $800,000 $1,102,600 $1,902,600 $800,000 $906,400 $1,706,400 $800,000 $800,000 $1,600,000 TOTAL LAB AND OE $2,657,600 $2.506,400 $2.400.000 Current Ratio Quick Ratio Inventory Turnover Inventory Days A/R Turnover A/R Days A/P Turnover A/P Days Cash Cyde Debt/Equity Debt/Total Assets Debt/EBITDA INCOME STATEMENT ACE HARDWARE For the 12 months Jan 1. Dec 31 Sales Cost of Goods Sold Gross Profit YEAR 3 $ 1,400,000 $ $ 1686.0001 $ 714,000 $ YEAR 2 1,555,000 $ 1275.000 $ 780,000 $ YEAR. 1,500,000 Izso.com 750,000 Operating Expenses Operating Profit $ 1224.000 490,000 $ 1749.000 531,000 $ 1200.000 $10,000 Interest Expense Profit Before Taxes $ $ (38,000) 452.000 $ 142.000) 489,000 (44,000) 466,000 Taxes Net Profit $ $ (180,800 $ 271,200 $ (195,600) $ 293.400 (186,400) 279,600 Dividends Paid S 75,000 $ 75,000 $ 75,000
Step by Step Solution
There are 3 Steps involved in it

Get step-by-step solutions from verified subject matter experts