

Question: Using the Bollinger Bands chart The dates you could have bought the stock at the lowest possible price. The dates you could have sold the
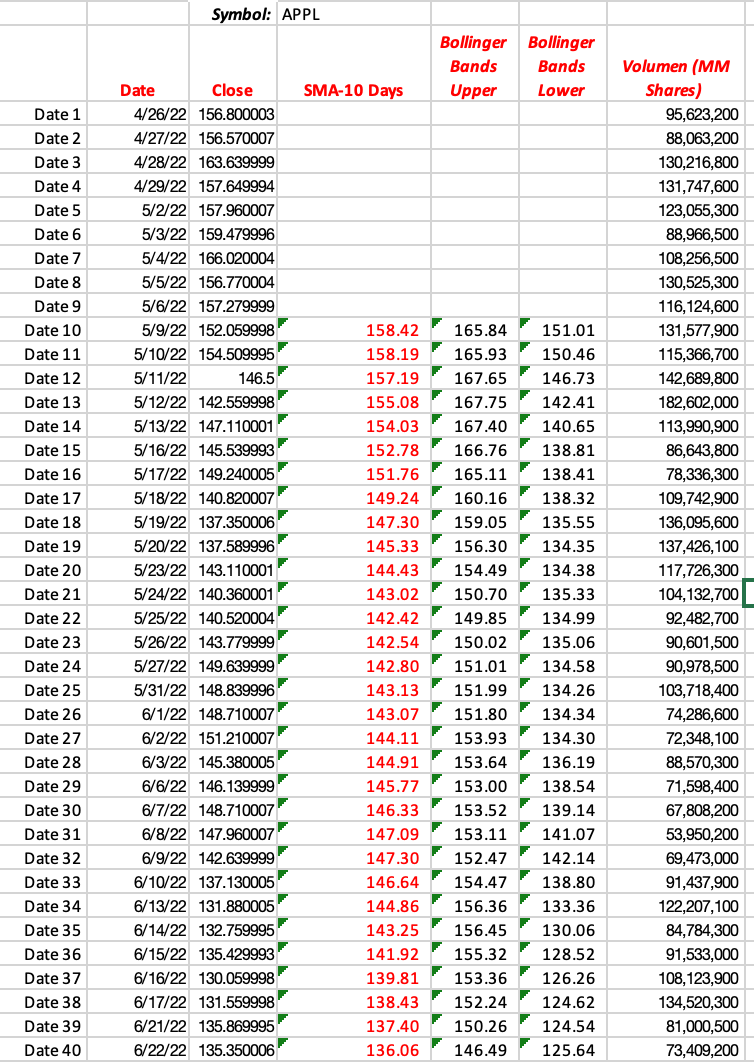
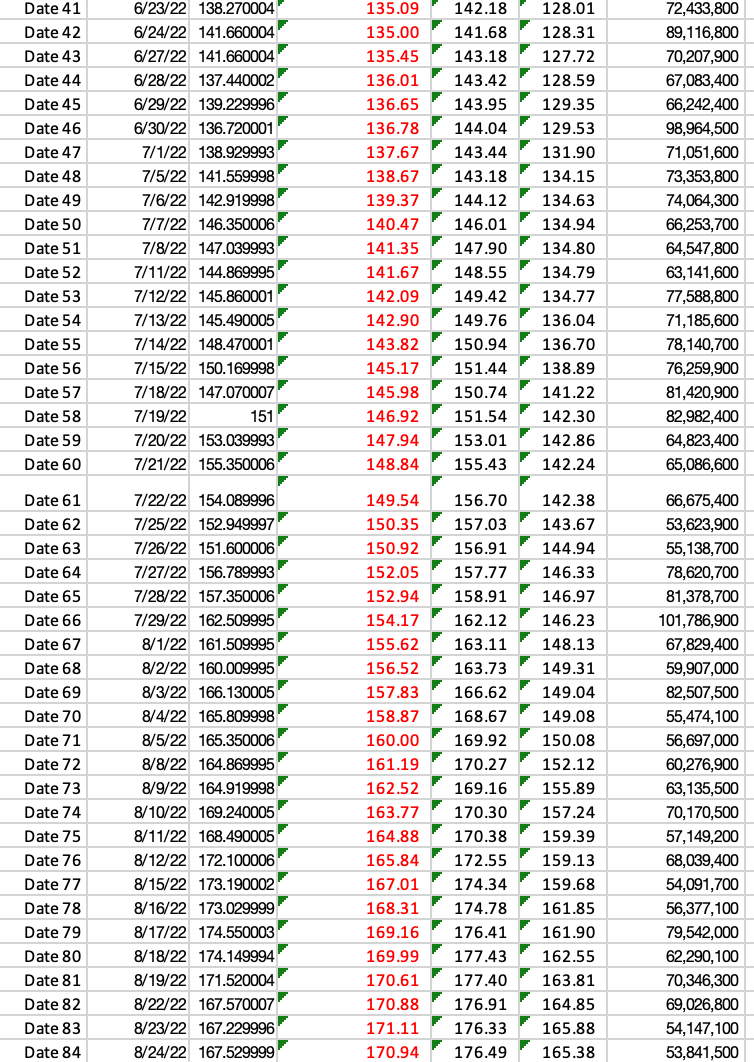
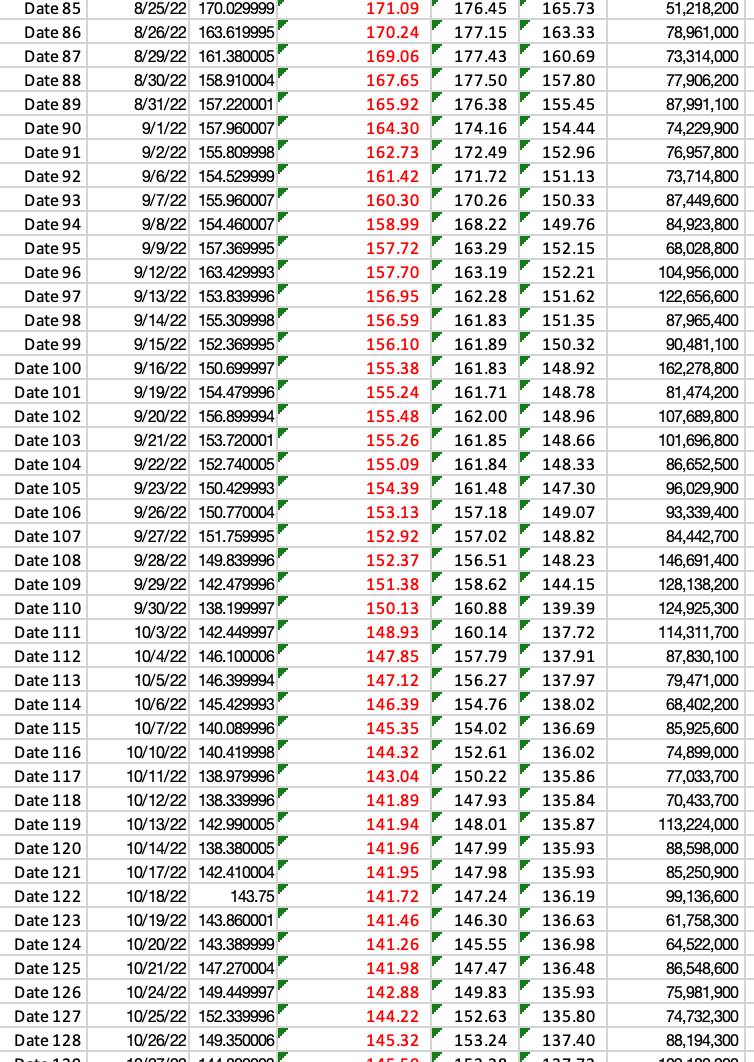
Using the Bollinger Bands chart The dates you could have bought the stock at the lowest possible price. The dates you could have sold the stock at the highest possible price. The behavior of the volume of shares sold. When the volume increased, what effect did it have on the price? When the volume dropped, what effect did it have on the price?
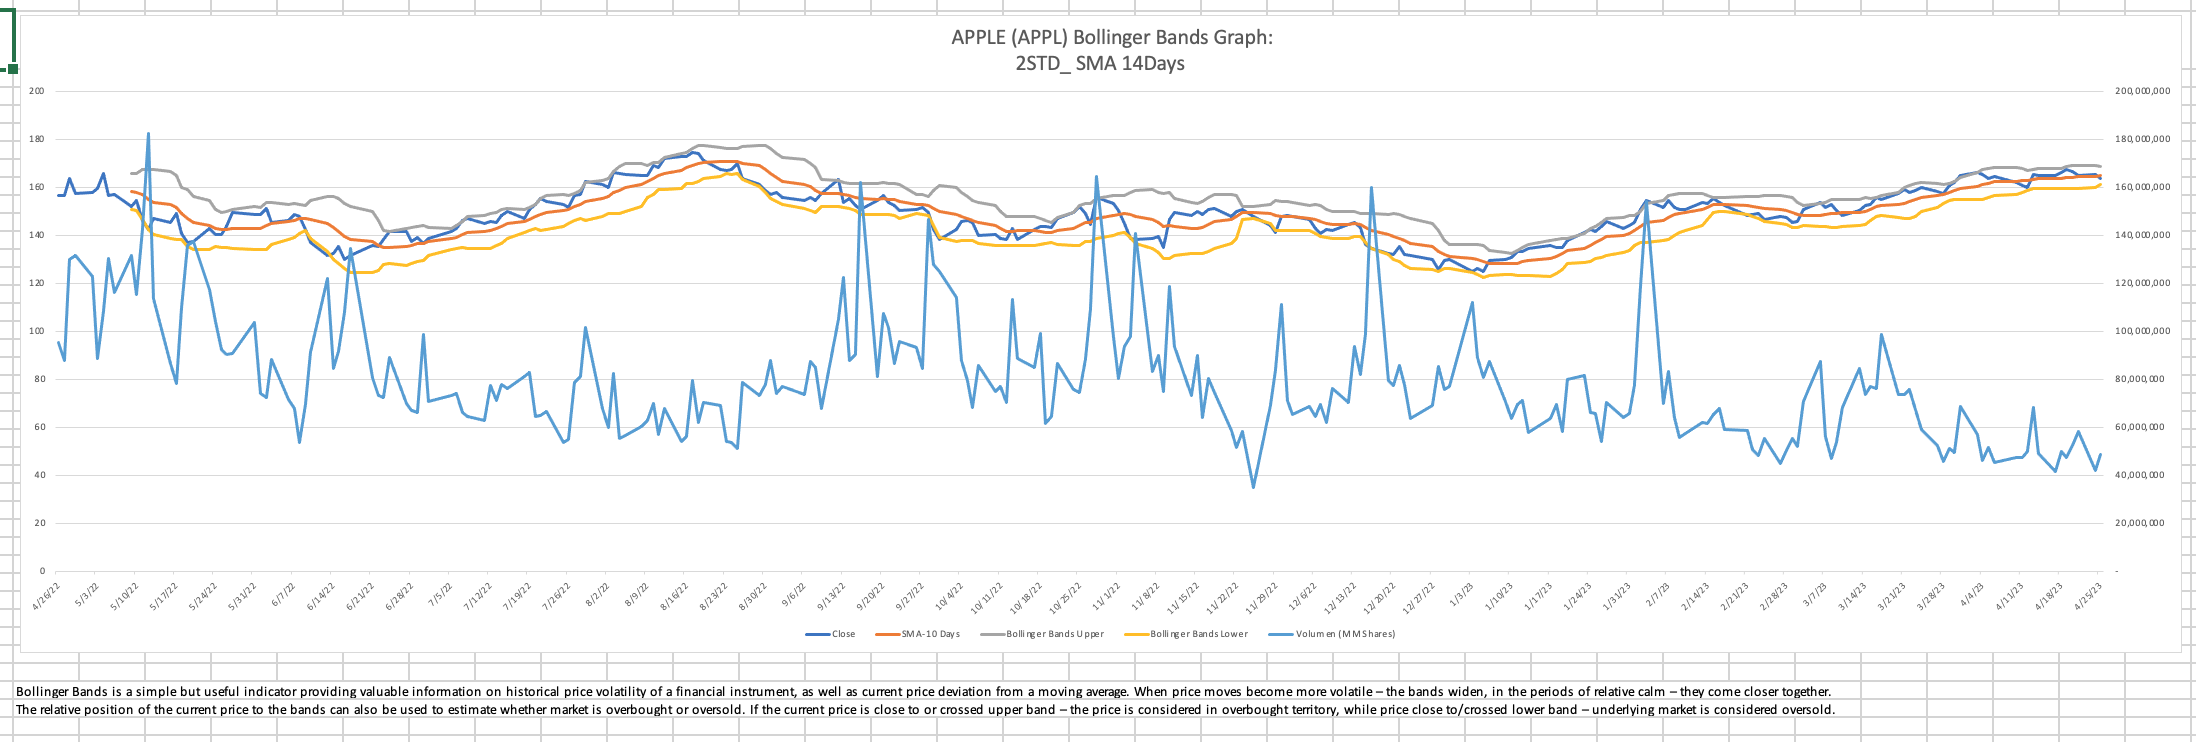
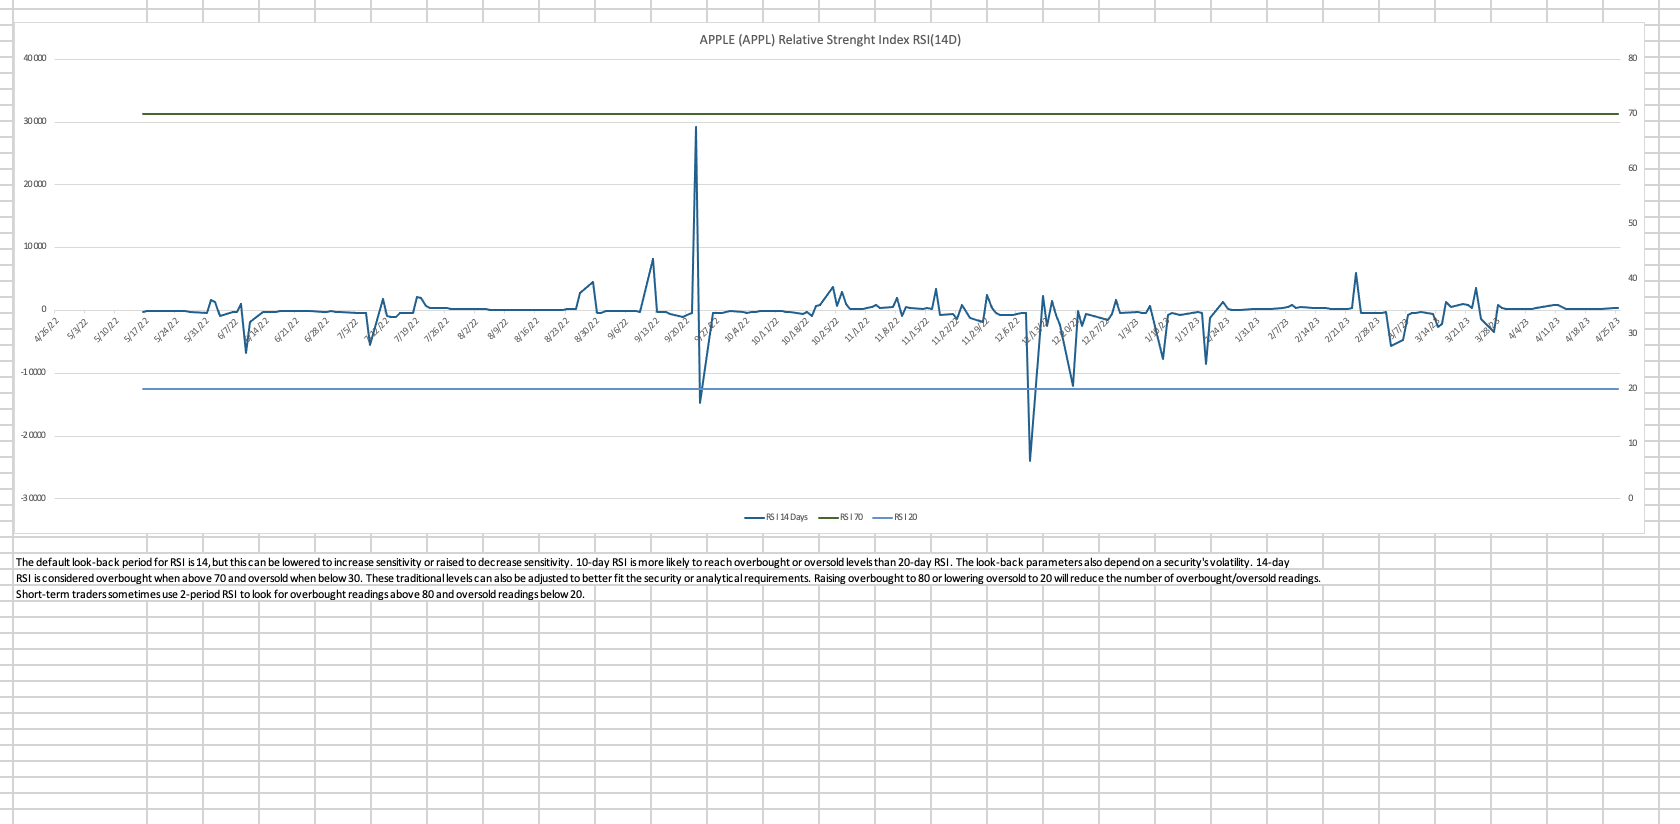
200 180 160 140 120 100 80 60 40 20 0 4/26/22 intretenida 5/3/22 5/10/22 5/17/22 5/24/22 5/31/22 6/7/22 6/14/22 wwwwwwwww 6/21/22 6/28/22 7/5/22 7/12/22 22/67/2 7/26/22 8/2/22 22/6/8 8/16/22 8/23/22 8/30/22 9/6/22 ZZ/ET/6 Close 9/20/22 9/27/22 APPLE (APPL) Bollinger Bands Graph: 2STD_SMA 14Days 10/4/22 SMA-10 Days 10/11/22 10/18/22 10/25/22 Bollinger Bands Upper 11/1/22 11/8/22 11/15/22 11/22/22 -Bollinger Bands Lower 11/29/22 12/6/22 12/13/22 12/20/22 Volumen (MMShares) 12/27/22 1/3/23 1/10/23 1/17/23 1/24/23 1/31/23 2/7/23 2/14/23 2/21/23 2/28/23 2/L/E 3/14/23 Bollinger Bands is a simple but useful indicator providing valuable information on historical price volatility of a financial instrument, as well as current price deviation from a moving average. When price moves become more volatile - the bands widen, in the periods of relative calm - they come closer together. The relative position of the current price to the bands can also be used to estimate whether market is overbought or oversold. If the current price is close to or crossed upper band - the price is considered in overbought territory, while price close to/crossed lower band - underlying market is considered oversold. 3/21/23 3/28/23 4/4/23 in 4/11/23 4/18/23 4/25/23 200,000,000 180,000,000 160,000,000 140,000,000 120,000,000 100,000,000 80,000,000 60,000,000 40,000,000 20,000,000
Step by Step Solution
There are 3 Steps involved in it
Dates you could have bought the stock at the lowest possible price When the stock price touched or f... View full answer

Get step-by-step solutions from verified subject matter experts