

Question: Using the box plot shown, answer the following questions: + + H + 9 10 11 12 13 14 a. Estimate the 5-number summary. Minimum
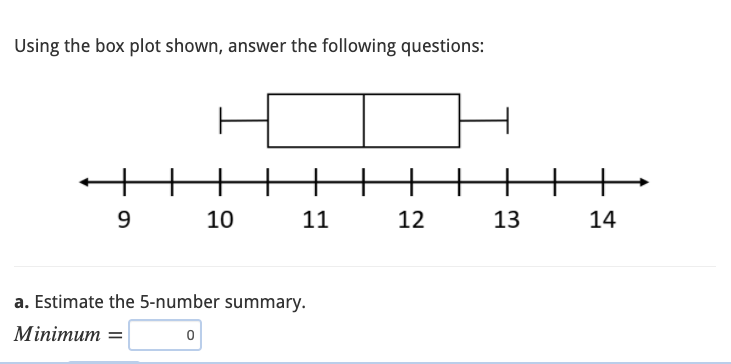
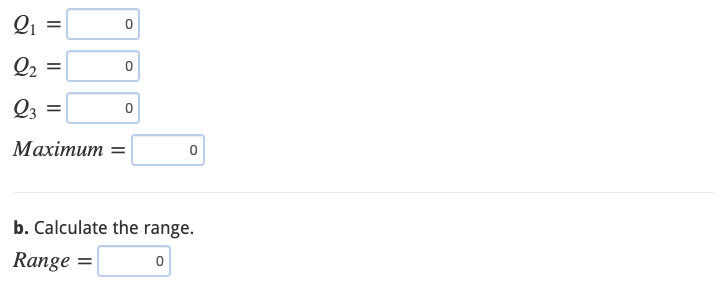
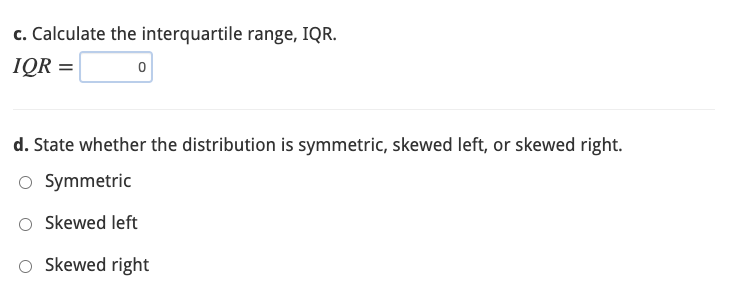
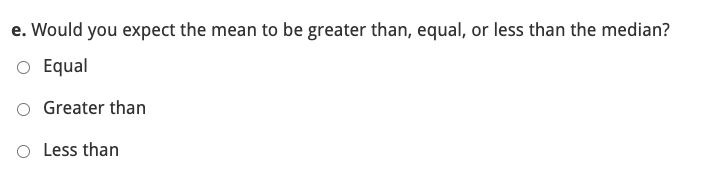
Using the box plot shown, answer the following questions: + + H + 9 10 11 12 13 14 a. Estimate the 5-number summary. Minimum = 0\fc. Calculate the interquartile range, IQR. IQR = 0 d. State whether the distribution is symmetric, skewed left, or skewed right. O Symmetric O Skewed left O Skewed righte. Would you expect the mean to be greater than, equal, or less than the median? (:11 Equal (:3 Greater than 0 Less than
Step by Step Solution
There are 3 Steps involved in it
1 Expert Approved Answer
Step: 1 Unlock

Question Has Been Solved by an Expert!
Get step-by-step solutions from verified subject matter experts
Step: 2 Unlock
Step: 3 Unlock