

Question: * Using the Case Study Notes and the accompanying spreadsheet, calculate the WACC of each Disney segment comparable. Describe the primary WACC drivers that explain
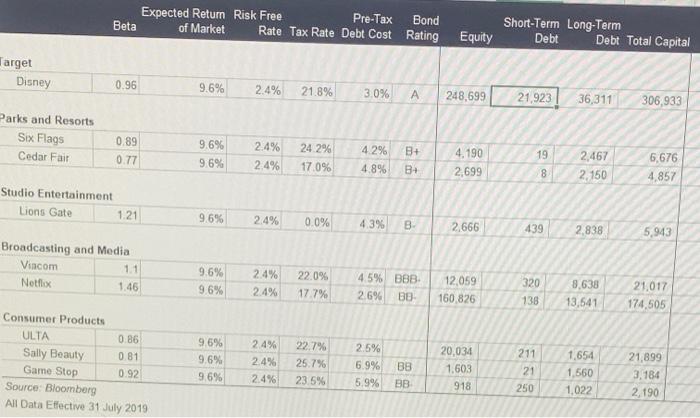
* Using the Case Study Notes and the accompanying spreadsheet, calculate the WACC of each Disney segment comparable. Describe the primary WACC drivers that explain the differences between the WACC of Disney and its comparables. Expected Return Risk Free Pre-Tax Bond Beta of Market Rate Tax Rate Debt Cost Rating Equity Short-Term Long-Term Debt Debt Total Capital Target Disney 0.96 9.6% 2.4% 21.8% 3.0% A 248,699 21.923 36,311 306,933 Parks and Resorts Six Flags Cedar Fair 0.89 0.77 9.6% 9.6% 2.4% 2.4% B+ 24.2% 17 0% 4.29% 4.8% 19 4.190 2,699 B+ 2,467 2,150 6,676 4,857 8 Studio Entertainment Lions Gate 1.21 9.6% 2.4% 0.0% 4.3% B 2.666 439 2,838 5,943 Broadcasting and Media Vac O. Netflix 1.46 9.6% 9.6% 2.4% 2.4% 22.09 17.7% 4.5% BBB 2.696 BE 12,059 160,826 320 138 9,638 13,541 21.017 174,505 Consumer Products ULTA 0.86 Sally Beauty 0.81 Game Stop 0.92 Source: Bloomberg All Data Effective 31 July 2019 9.6% 9.6% 9.6% 24% 2.4% 2.4% 22.7% 25.7% 23.5% 2.5% 6.9% 5.9% BB BB 20.034 1,603 918 211 21 250 1.654 1.560 1,022 21,899 3.184 2,190
Step by Step Solution
There are 3 Steps involved in it

Get step-by-step solutions from verified subject matter experts