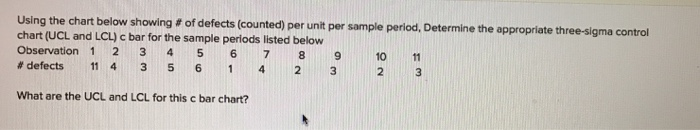
Question: Using the chart below showing # of defects (counted) per unit per sample period, Determine the appropriate three-sigma control chart (UCL and LCL) c bar

Using the chart below showing # of defects
Using the chart below showing # of defects (counted) per unit per sample period, Determine the appropriate three-sigma control chart (UCL and LCL) c bar for the sample periods listed below Observation 1 2 3 4 5 6 7 # defects 11 4 3 5 6 What are the UCL and LCL for this c bar chart? Multiple Choice and -2 O 4 and -2 o o o o of 6 and 2 10 and o 8 and 11.3

Step by Step Solution

There are 3 Steps involved in it

1 Expert Approved Answer
Step: 1 Unlock blur-text-image
Question Has Been Solved by an Expert!

Get step-by-step solutions from verified subject matter experts

Step: 2 Unlock
Step: 3 Unlock

Students Have Also Explored These Related General Management Questions!