

Question: Using the chart could you describe PepsiCo value chain analysis for the year of 2016. r Chandler (CSU Fullerton Figure 4.3 A Representative Company Value
Using the chart could you describe PepsiCo value chain analysis for the year of 2016. 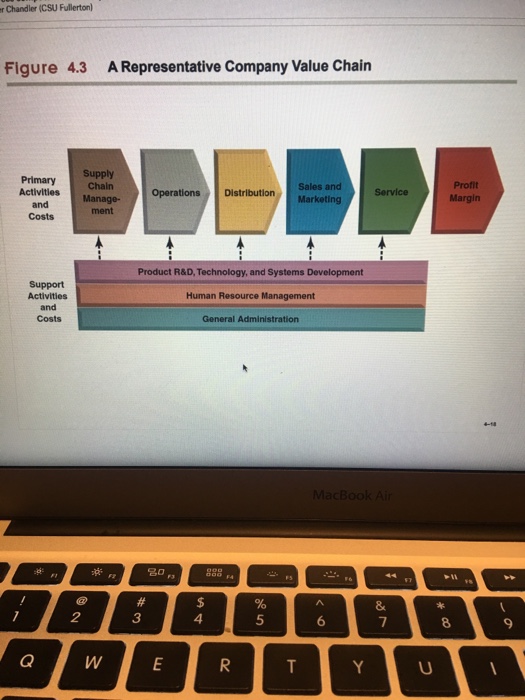
r Chandler (CSU Fullerton Figure 4.3 A Representative Company Value Chain Primary Supply ActivitiesManage Sales and DistributionMarketing Profit Operations D Costs Product R&D,Technology, and Systems Support Activities and Human Resource Management General Administration 20 p 2 3 4 9
Step by Step Solution
There are 3 Steps involved in it
1 Expert Approved Answer
Step: 1 Unlock

Question Has Been Solved by an Expert!
Get step-by-step solutions from verified subject matter experts
Step: 2 Unlock
Step: 3 Unlock