

Question: Using the .csv file provided in the previous question, create the following three plots: 1. Scatter plot of Cholesterol on the y-axis versus BP on
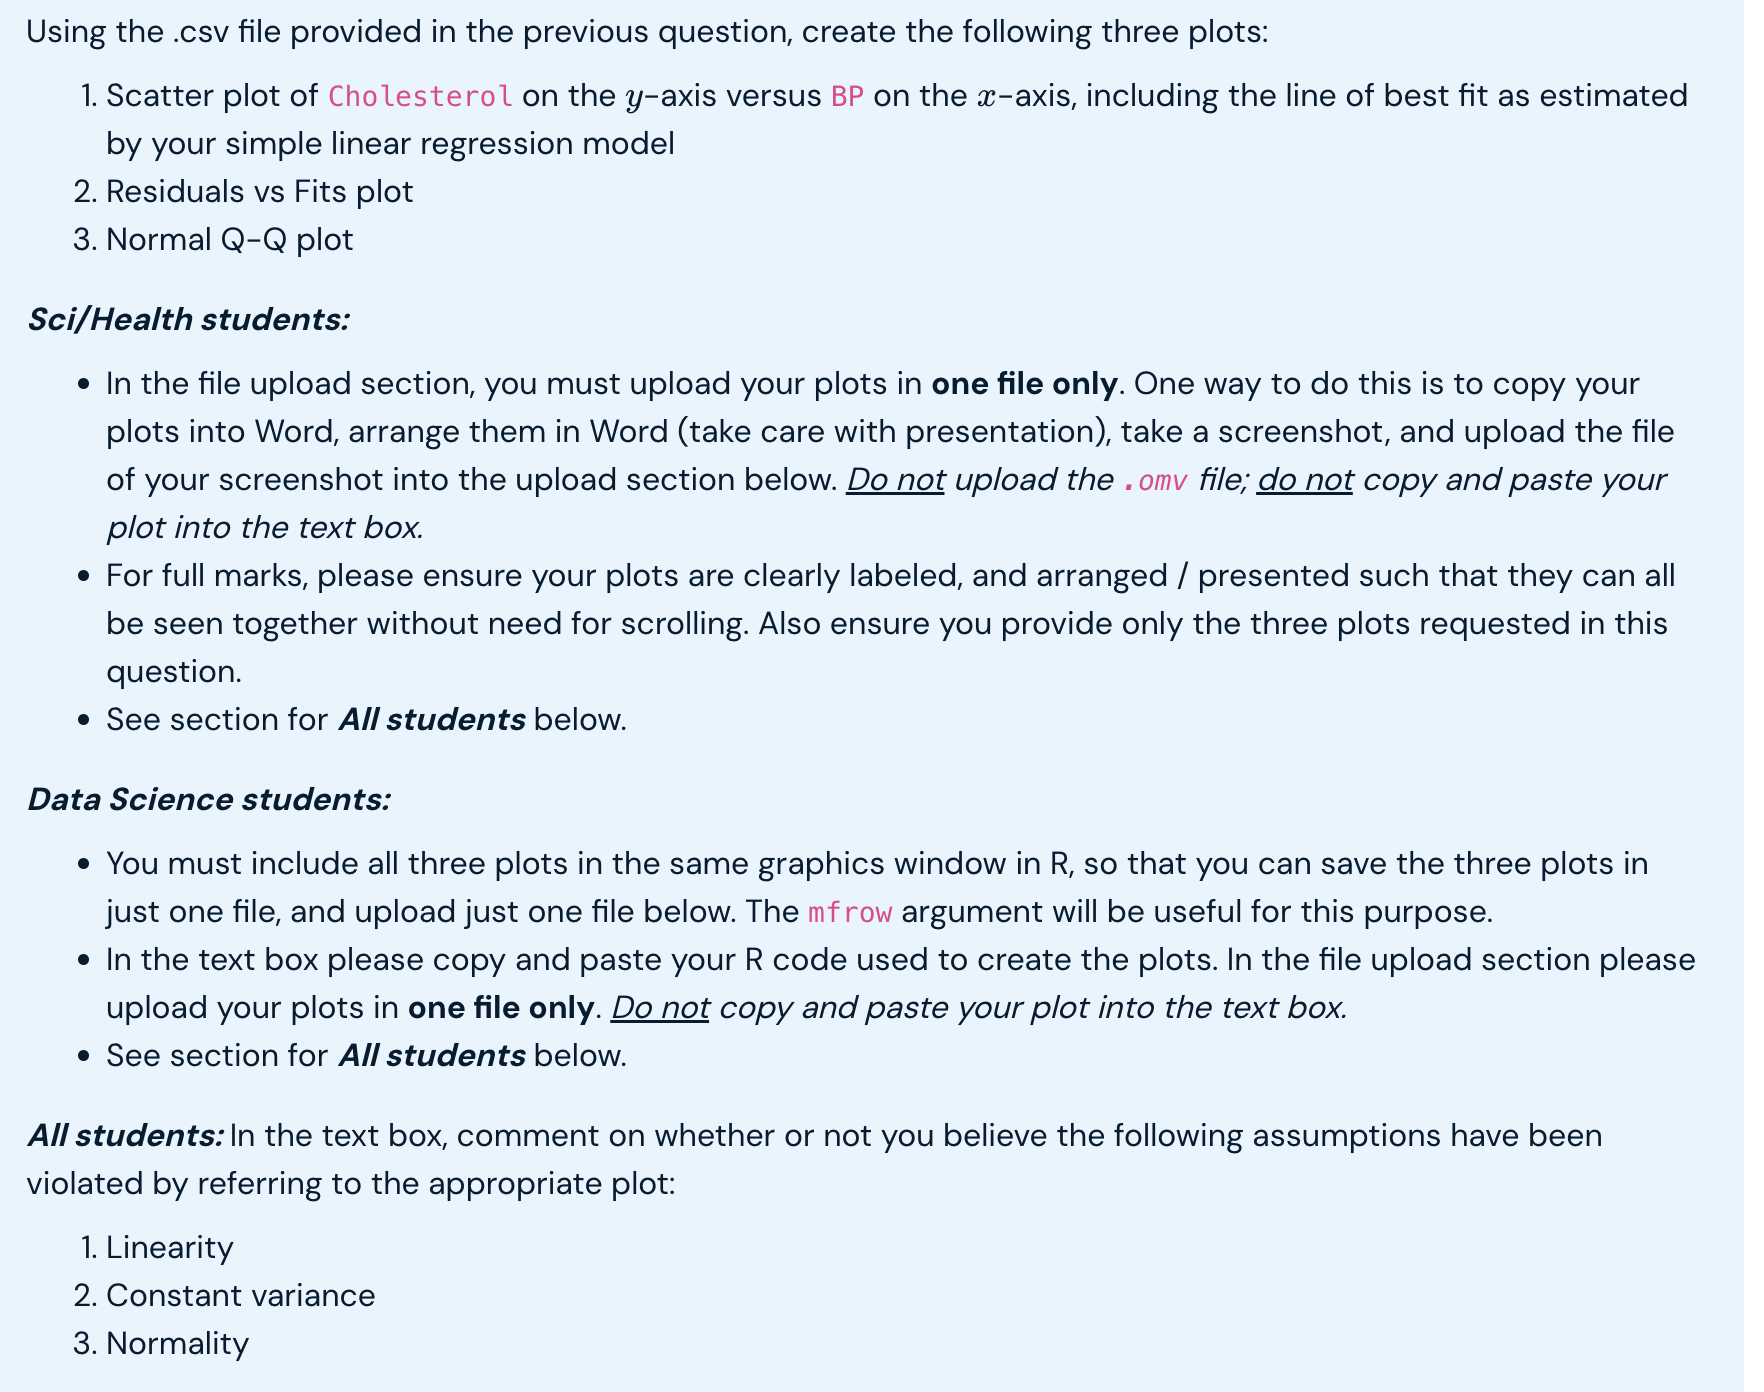
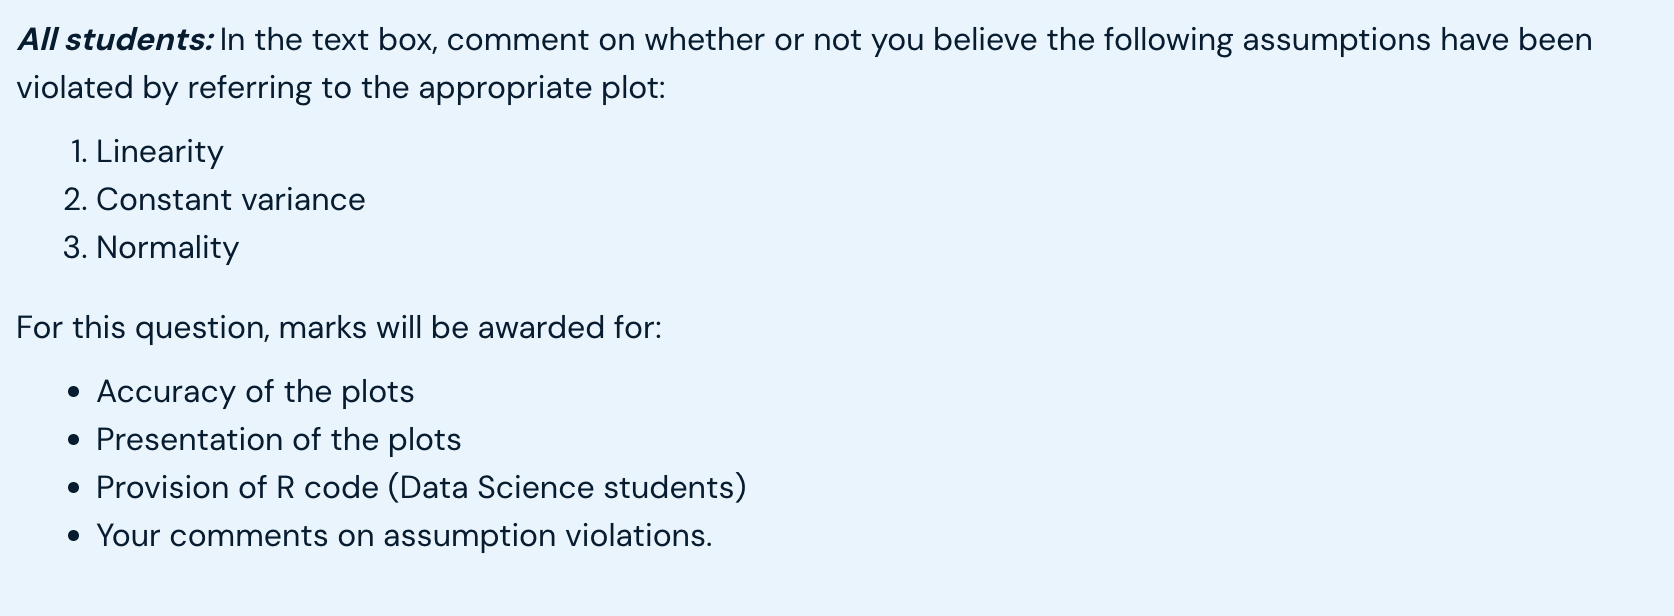
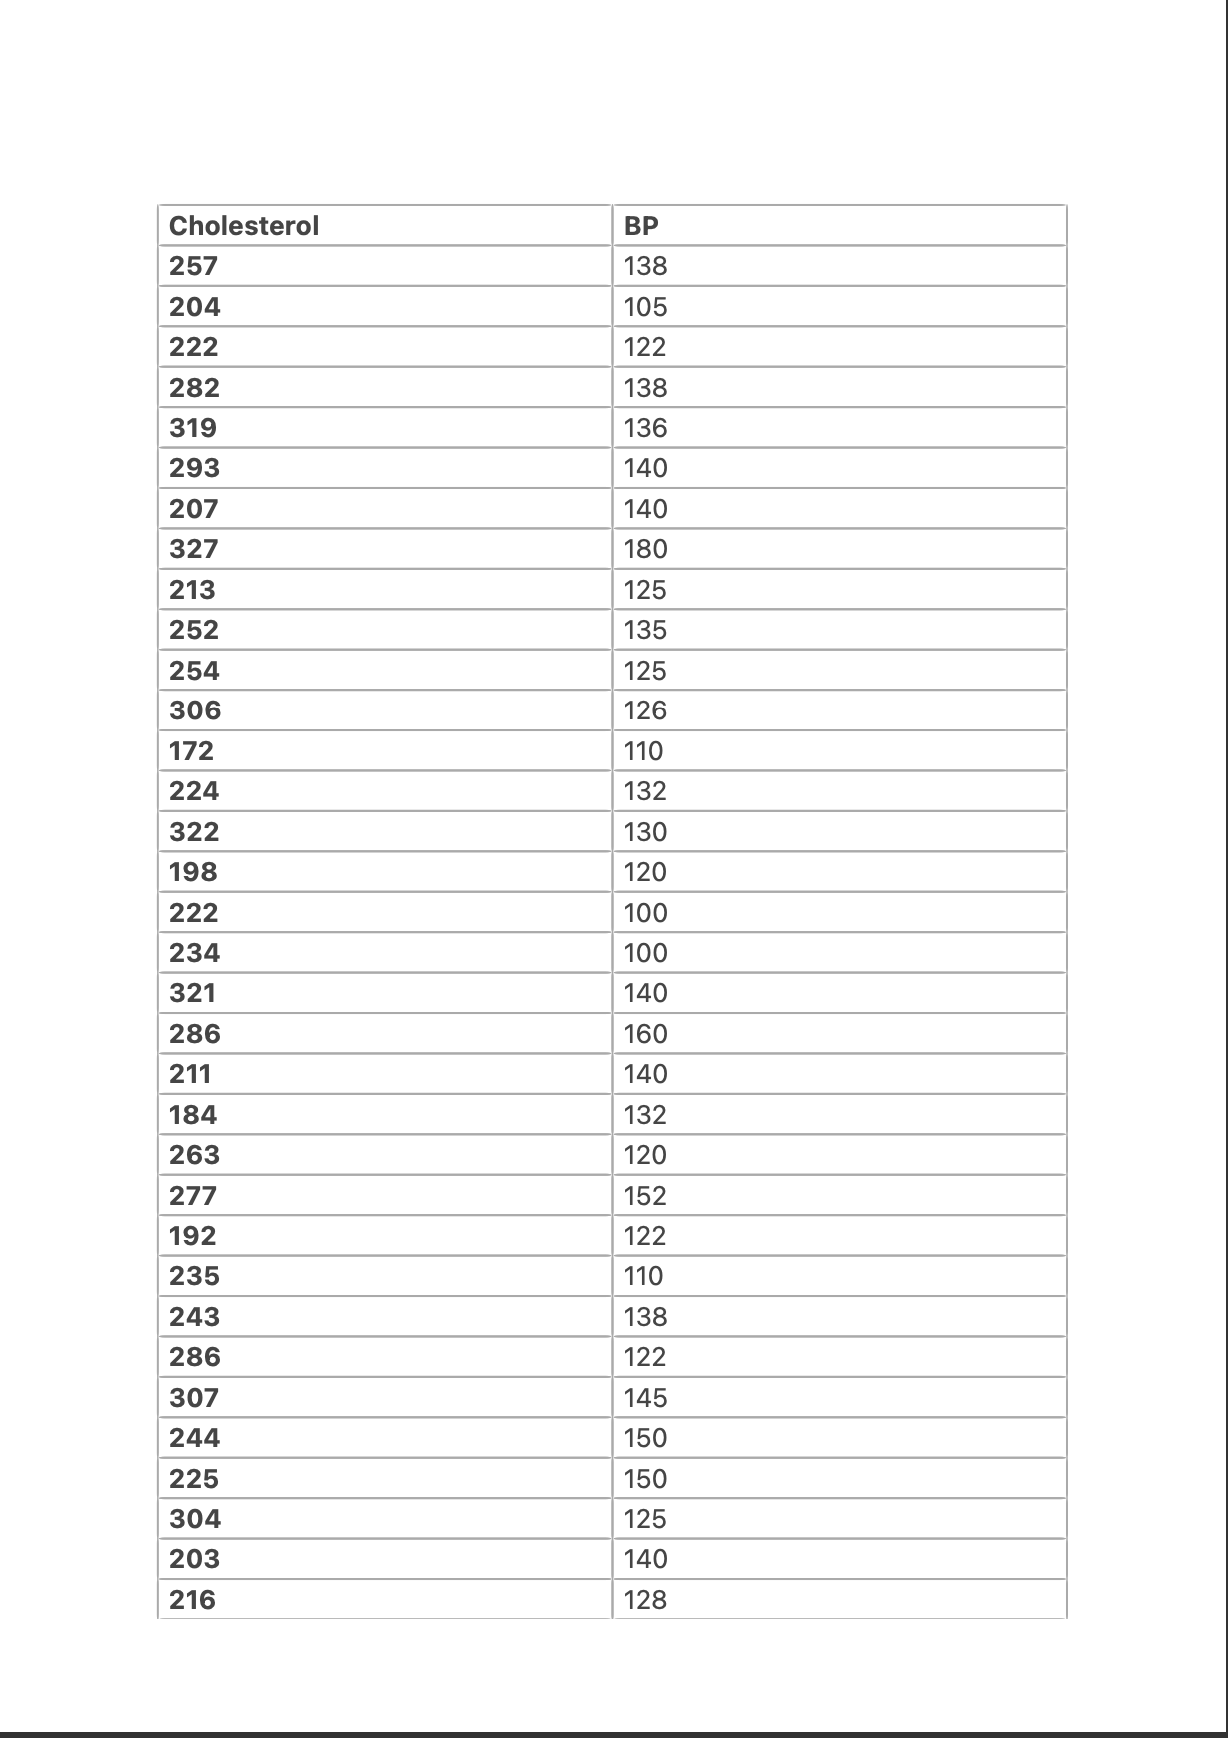
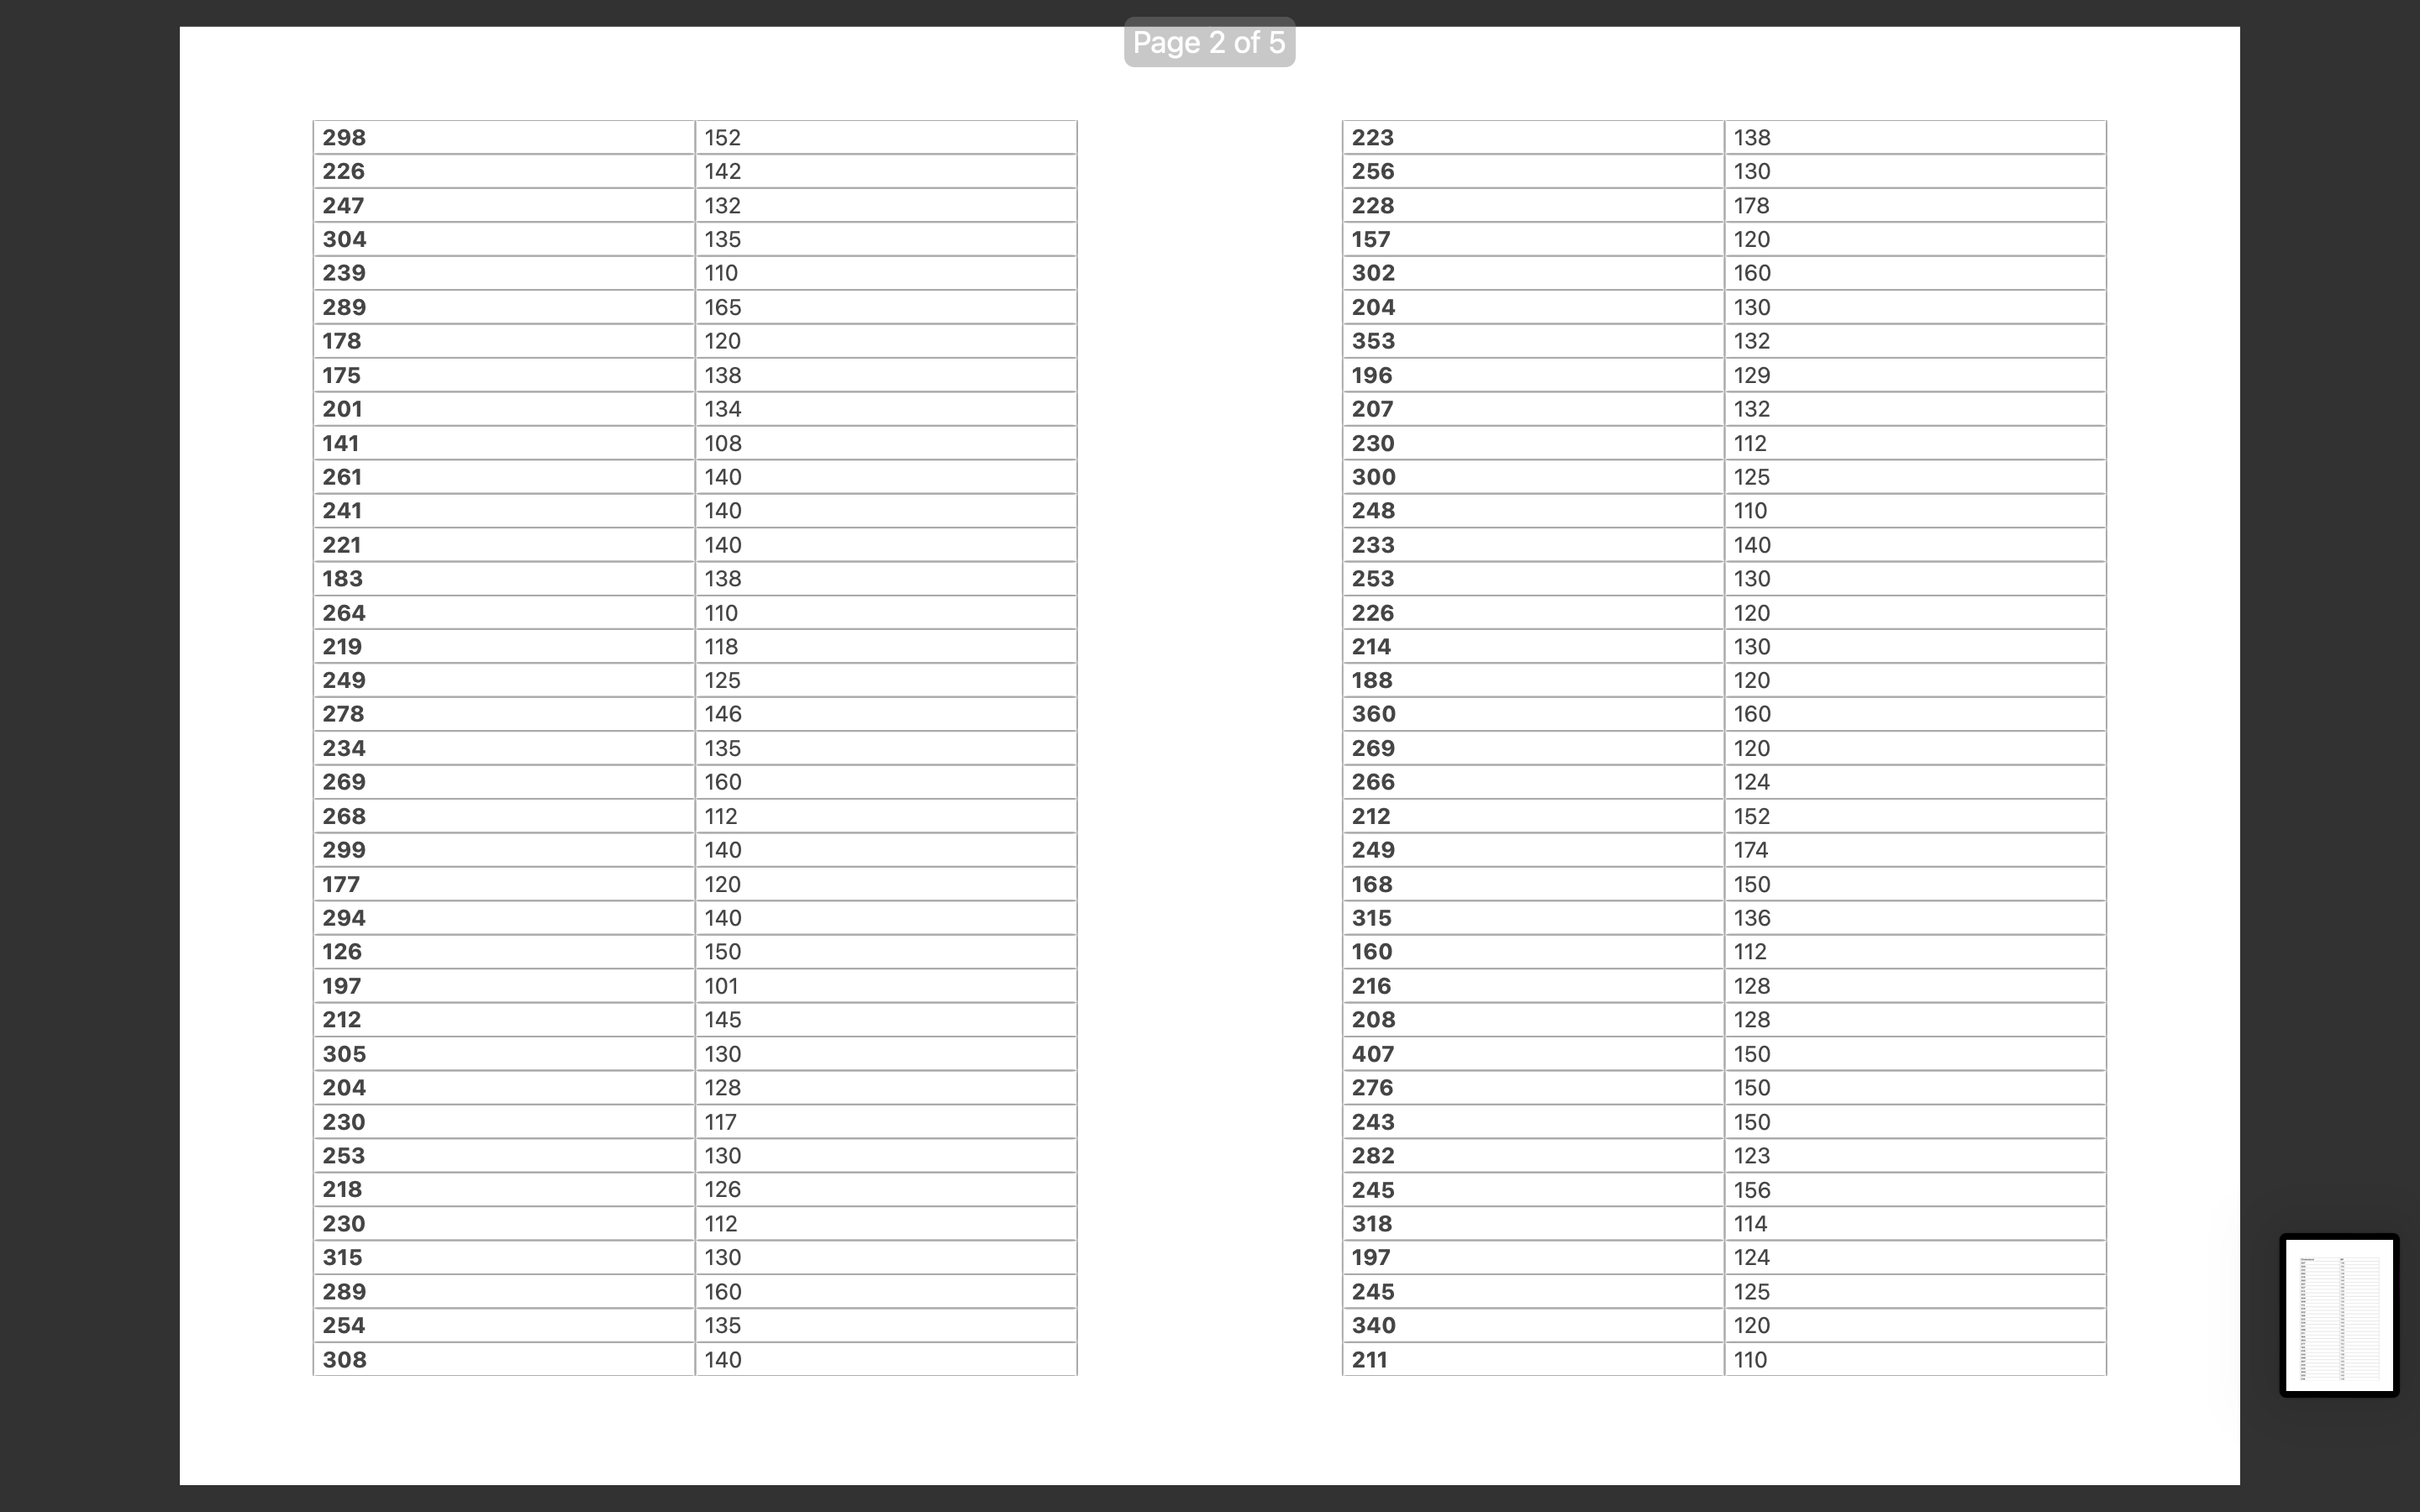
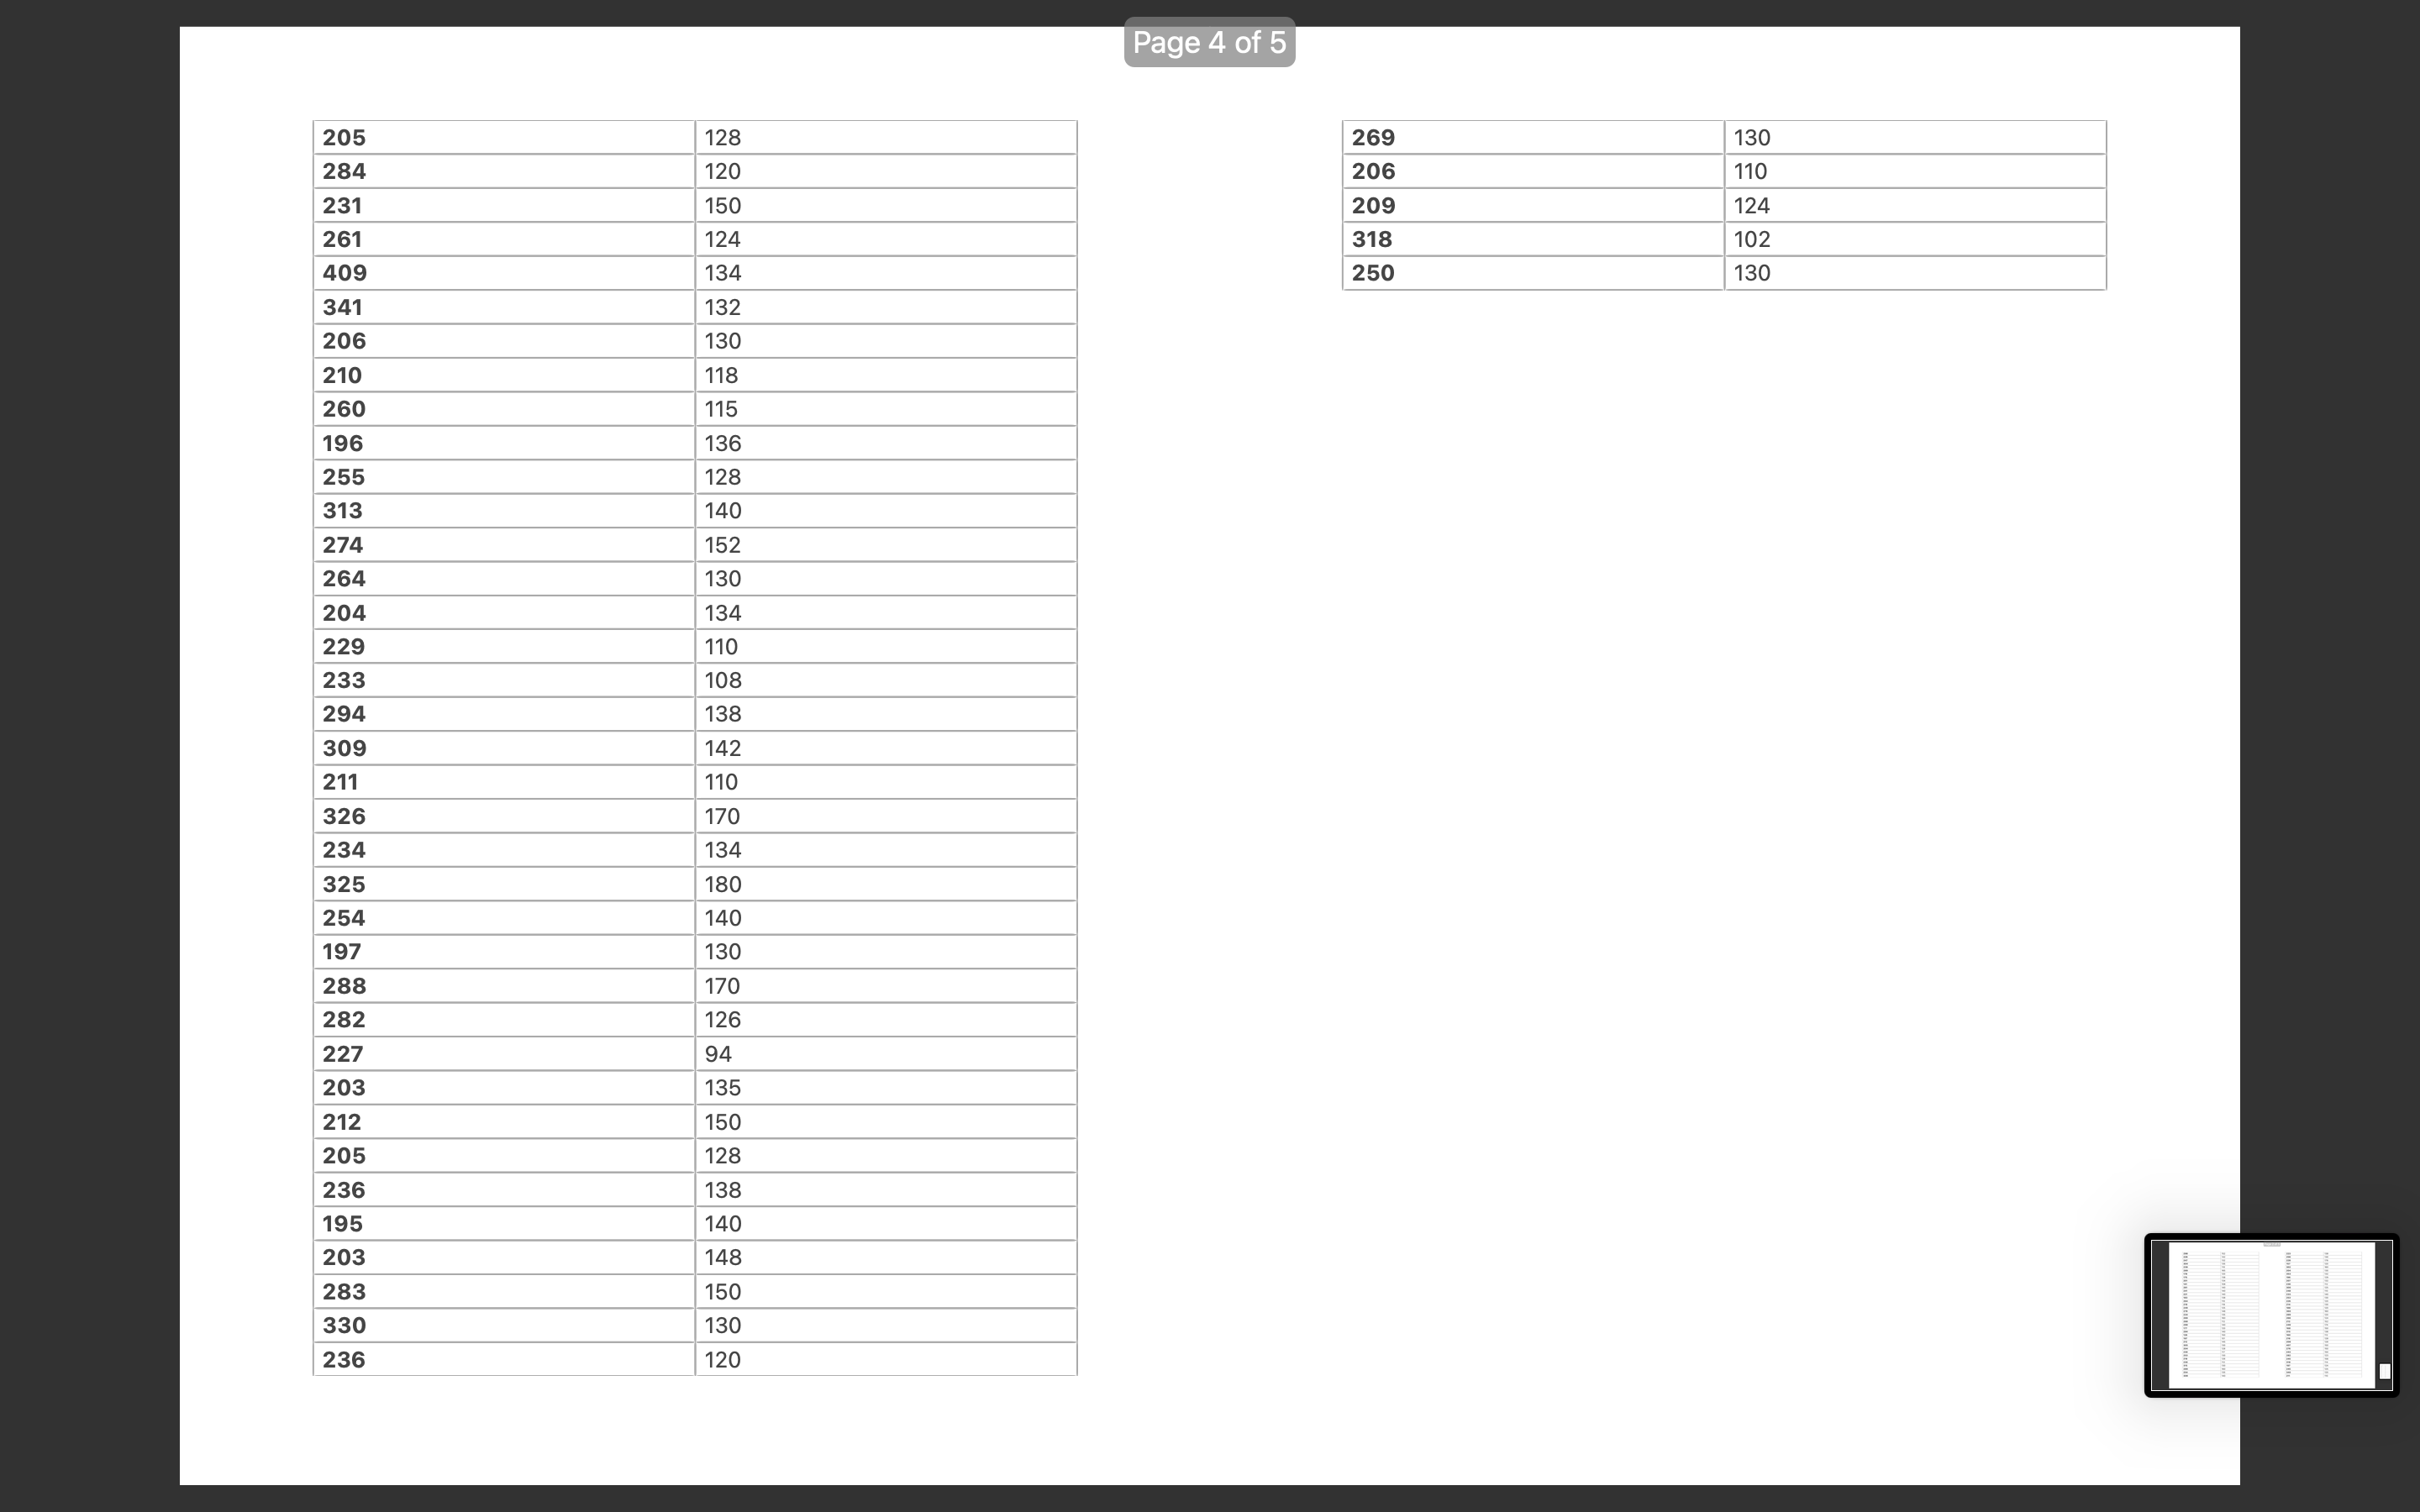
Using the .csv file provided in the previous question, create the following three plots: 1. Scatter plot of Cholesterol on the y-axis versus BP on the z-axis, including the line of best fit as estimated by your simple linear regression model 2. Residuals vs Fits plot 3. Normal Q-Q plot Sci/Health students: In the file upload section, you must upload your plots in one file only. One way to do this is to copy your plots into Word, arrange them in Word (take care with presentation), take a screenshot, and upload the file of your screenshot into the upload section below. Do not upload the .onv file; do not copy and paste your plot into the text box. e For full marks, please ensure your plots are clearly labeled, and arranged / presented such that they can all be seen together without need for scrolling. Also ensure you provide only the three plots requested in this question. e See section for All students below. Data Science students: You must include all three plots in the same graphics window in R, so that you can save the three plots in just one file, and upload just one file below. The mf row argument will be useful for this purpose. In the text box please copy and paste your R code used to create the plots. In the file upload section please upload your plots in one file only. Do not copy and paste your plot into the text box. e See section for All students below. All students: In the text box, comment on whether or not you believe the following assumptions have been violated by referring to the appropriate plot: 1. Linearity 2. Constant variance 3. Normality All students: In the text box, comment on whether or not you believe the following assumptions have been violated by referring to the appropriate plot: 1. Linearity 2. Constant variance 3. Normality For this question, marks will be awarded for: e Accuracy of the plots e Presentation of the plots e Provision of R code (Data Science students) e Your comments on assumption violations. \f\f\f
Step by Step Solution
There are 3 Steps involved in it

Get step-by-step solutions from verified subject matter experts