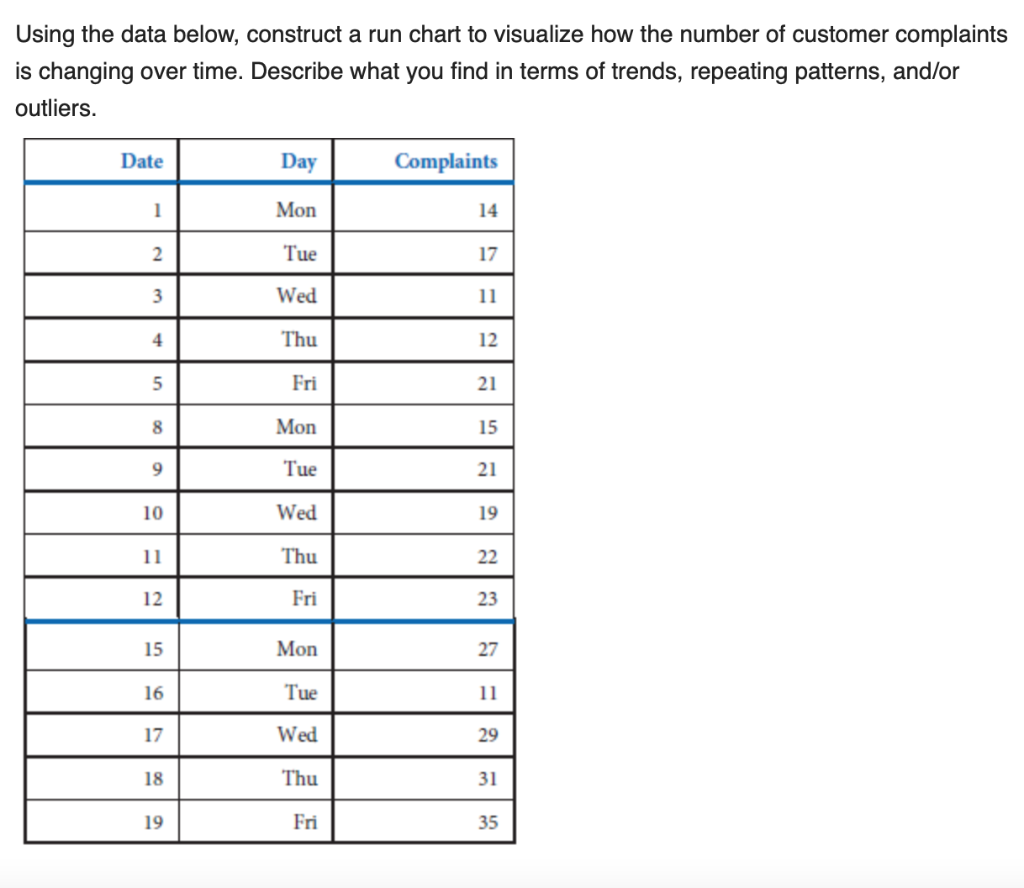
Question: Using the data below, construct a run chart to visualize how the number of customer complaints is changing over time. Describe what you find in

Using the data below, construct a run chart to

Using the data below, construct a run chart to visualize how the number of customer complaints is changing over time. Describe what you find in terms of trends, repeating patterns, and/or outliers. Date Day Complaints 1 Mon 14 2 Tue 17 3 Wed 11 4 Thu 12 5 Fri 21 8 Mon 15 9 Tue 21 10 Wed 19 11 Thu 22 12 Fri 23 15 Mon 27 16 Tue 11 17 Wed 29 18 Thu 31 19 Fri 35

Step by Step Solution

There are 3 Steps involved in it

1 Expert Approved Answer
Step: 1 Unlock blur-text-image
Question Has Been Solved by an Expert!

Get step-by-step solutions from verified subject matter experts

Step: 2 Unlock
Step: 3 Unlock

Students Have Also Explored These Related General Management Questions!