

Question: Using the data below, construct a run chart to visualize how the number of customer complaints is changing over time. Describe what you find in
Using the data below, construct a run chart to visualize how the number of customer complaints is changing over time. Describe what you find in terms of trends, repeating patterns, and/or outliers.
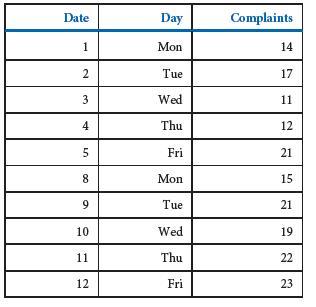
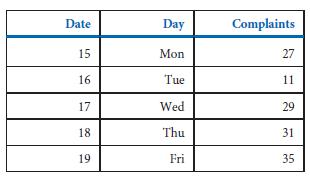
Date Day Complaints 1 Mon 14 2 Tue 17 3 Wed 11 4 Thu 12 5 Fri 21 8 Mon 15 9 Tue 21 10 Wed 19 11 Thu 22 12 Fri 23
Step by Step Solution
There are 3 Steps involved in it
1 Expert Approved Answer
Step: 1 Unlock

Question Has Been Solved by an Expert!
Get step-by-step solutions from verified subject matter experts
Step: 2 Unlock
Step: 3 Unlock