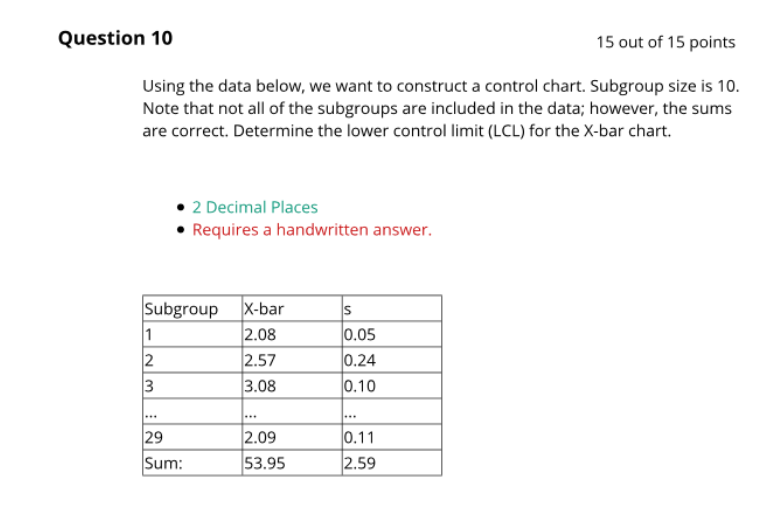
Question: Using the data below, we want to construct a control chart. Subgroup size is 10. Note that not all of the subgroups are included in

Using the data below, we want to construct a

Using the data below, we want to construct a control chart. Subgroup size is 10. Note that not all of the subgroups are included in the data; however, the sums are correct. Determine the lower control limit (LCL) for the X-bar chart. - 2 Decimal Places - Requires a handwritten

Step by Step Solution

There are 3 Steps involved in it

1 Expert Approved Answer
Step: 1 Unlock blur-text-image
Question Has Been Solved by an Expert!

Get step-by-step solutions from verified subject matter experts

Step: 2 Unlock
Step: 3 Unlock

Students Have Also Explored These Related General Management Questions!