

Question: Using the data below, we want to construct a control chart. Subgroup size is 4. Note that not all of the subgroups are included
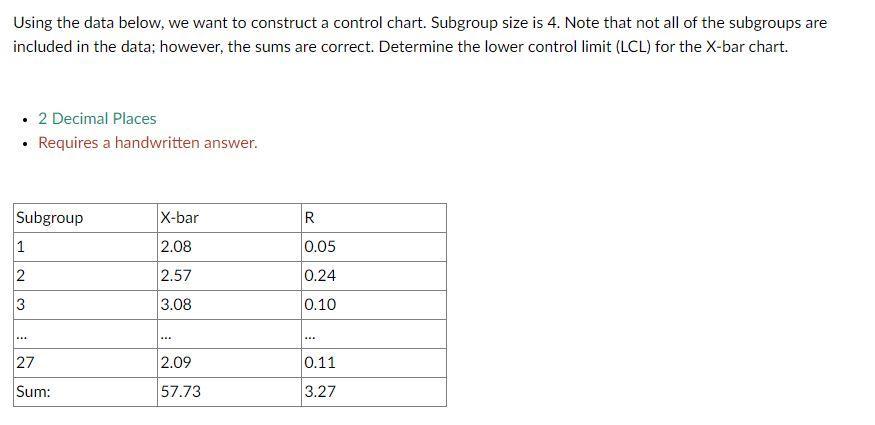
Using the data below, we want to construct a control chart. Subgroup size is 4. Note that not all of the subgroups are included in the data; however, the sums are correct. Determine the lower control limit (LCL) for the X-bar chart. 2 Decimal Places Requires a handwritten answer. Subgroup X-bar R 1 2.08 0.05 2 2.57 0.24 3 3.08 0.10 27 2.09 0.11 Sum: 57.73 3.27
Step by Step Solution
There are 3 Steps involved in it
1 Expert Approved Answer
Step: 1 Unlock

Question Has Been Solved by an Expert!
Get step-by-step solutions from verified subject matter experts
Step: 2 Unlock
Step: 3 Unlock