

Question: Using the data collected from the operations process data (Exhibit 2) provided, identify the control limits of the X-bar and R charts. Graph the charts
Using the data collected from the operations process data (Exhibit 2) provided, identify the control limits of the X-bar and R charts. Graph the charts and determine if the process is in control or not.
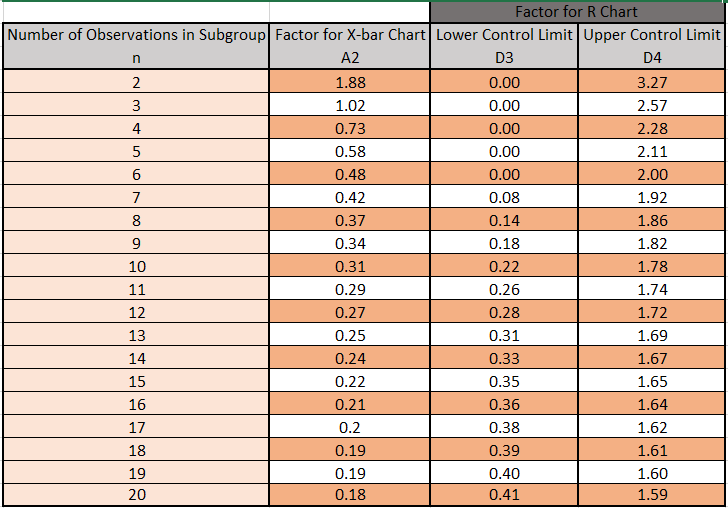
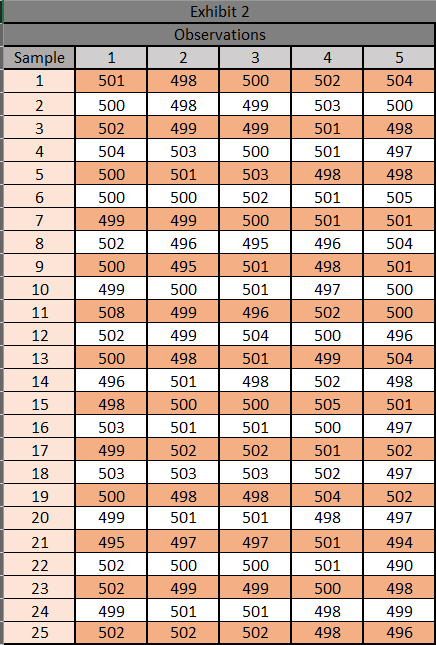
Exhibit 2
Step by Step Solution
There are 3 Steps involved in it
1 Expert Approved Answer
Step: 1 Unlock

Question Has Been Solved by an Expert!
Get step-by-step solutions from verified subject matter experts
Step: 2 Unlock
Step: 3 Unlock