

Question: Using the data file, run descriptive statistics of N. What are mean and standard deviation respectively? (Hint: Use Data Analysis add-on in excel and
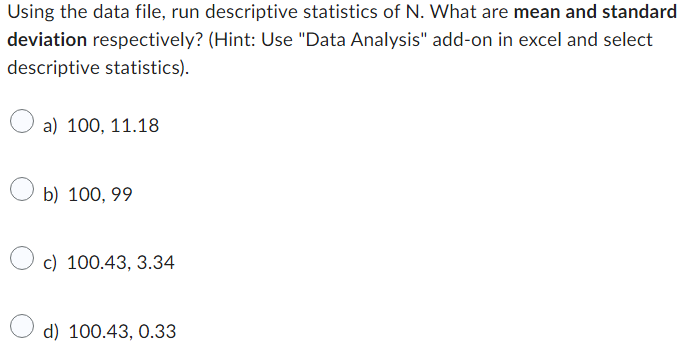
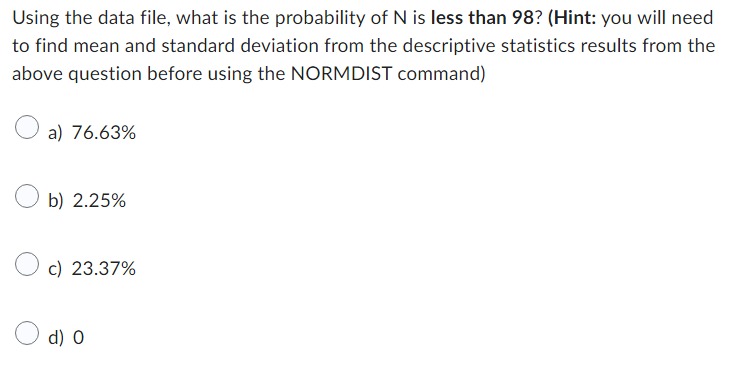
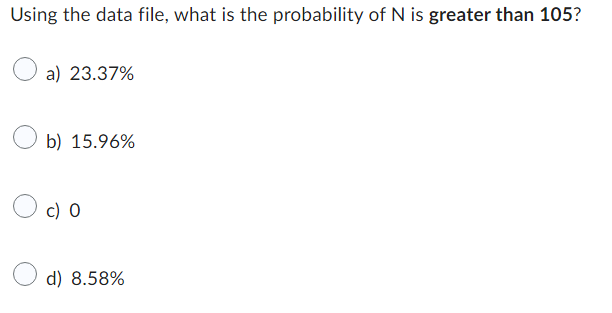
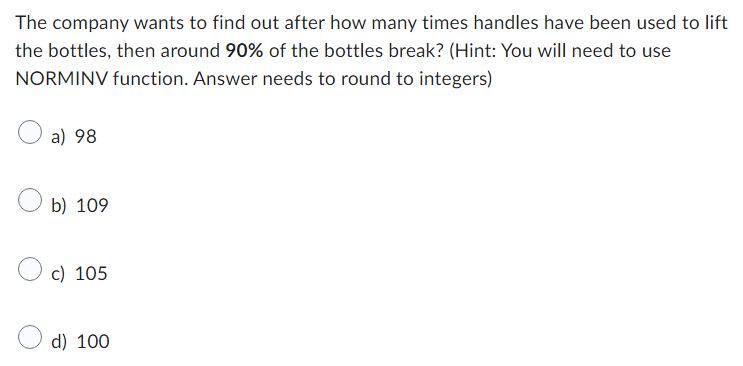
Using the data file, run descriptive statistics of N. What are mean and standard deviation respectively? (Hint: Use "Data Analysis" add-on in excel and select descriptive statistics). a) 100, 11.18 b) 100, 99 c) 100.43, 3.34 d) 100.43, 0.33 Using the data file, what is the probability of N is less than 98? (Hint: you will need to find mean and standard deviation from the descriptive statistics results from the above question before using the NORMDIST command) a) 76.63% b) 2.25% c) 23.37% d) O Using the data file, what is the probability of N is greater than 105? a) 23.37% b) 15.96% c) O d) 8.58% The company wants to find out after how many times handles have been used to lift the bottles, then around 90% of the bottles break? (Hint: You will need to use NORMINV function. Answer needs to round to integers) a) 98 b) 109 c) 105 d) 100 Using the data file, what is the 95% confidence interval? a) (99.00, 102.76) b) (100.43, 109) c) (99.77, 101.09) d) (100.43, 109)
Step by Step Solution
There are 3 Steps involved in it

Get step-by-step solutions from verified subject matter experts