

Question: . Using the data from question 1, construct a frequency table and percentage distribution for class. Race Race Class W Trauma L Race Class W
. Using the data from question 1, construct a frequency table and percentage distribution for class.
Race
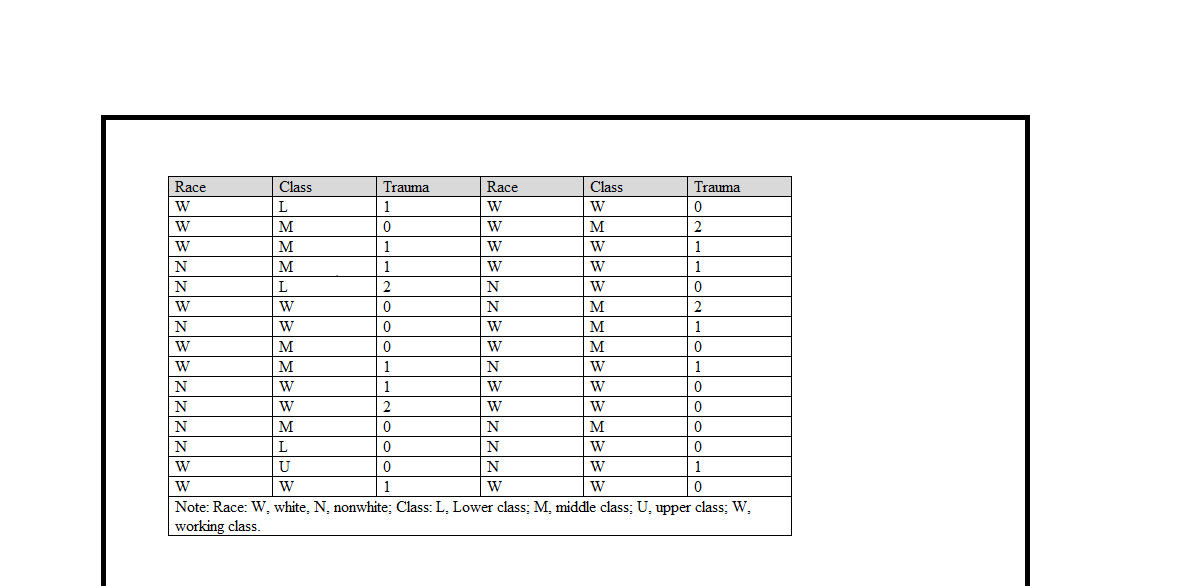
Race Class W Trauma L Race Class W 1 W Trauma M W 0 0 W W M M N W 2 M 1 W N W L W W 2 W N W 0 0 N W N W 0 M M W 2 0 M W W M M N 0 N W W N W W W 0 N 2 W M W 0 N 0 L N 0 M 0 W U W O N W 0 W N 1 W W W working class. Note: Race: W, white, N, nonwhite; Class: L. Lower class; M. middle class; U. upper class; W. 0
Step by Step Solution
There are 3 Steps involved in it
1 Expert Approved Answer
Step: 1 Unlock

Question Has Been Solved by an Expert!
Get step-by-step solutions from verified subject matter experts
Step: 2 Unlock
Step: 3 Unlock