

Question: Using the data from table 12.7 (Module 4, Week 4 Data Sets and Exercises), conduct recursive least squares on the model Ceintercept+BsA+ for the periods
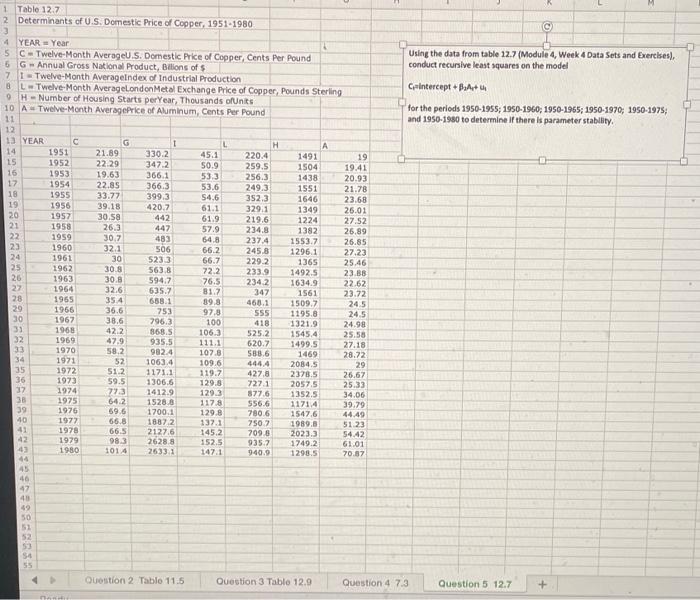
Using the data from table 12.7 (Module 4, Week 4 Data Sets and Exercises), conduct recursive least squares on the model Ceintercept+BsA+ for the periods 1950-1955, 1950-1960;1950-1965; 1950-1970; 1950-1975; and 1950-1980 to determine if there is parameter stability. A 1 Table 12.7 2 Determinants of U.S. Domestic Price of Copper, 1951-1980 3 4 YEAR = Year 5 C-Twelve Month AverageU.S. Domestic Price of Copper, Cents Per Pound 6 G Annual Gross National Product, Bilions of $ 7 1 Twelve-Month AverageIndex of Industrial Production BL Twelve Month Averagelondon Metal Exchange Price of Copper, Pounds Sterling OH - Number of Housing Starts perYear, Thousands ofUnits 10 A Twelve-Month AveragePrice of Aluminum, Cents Per Pound 11 12 13 YEAR G 1 L H A 14 1951 21.89 330.2 45.1 220.4 1491 19 15 1952 22:29 347.2 50.9 259.5 1504 16 19.41 1953 19.63 366.1 533 256.3 1438 20.93 17 1954 22.85 366.3 53.6 249.3 1551 21.78 18 1955 33.77 399.3 54.6 3523 1646 23.68 19 1956 39.18 420.2 61.1 329.1 20 1349 26.01 1957 30.58 442 61.9 219.6 1224 27.52 21 1958 26.3 447 57.9 234.8 1382 26.89 22 1959 30.7 483 64.8 237.4 1553.7 26.85 23 1960 32.1 506 66.2 245.8 1296.1 27,23 24 1961 30 5233 66.7 229.2 1365 25.46 25 1962 30.8 563.8 72.2 233.9 1492.5 26 23.38 1963 30.8 594.7 76.5 234.2 1634.9 22.62 27 1964 32.6 635.7 81.7 347 1561 23.72 28 1955 35.4 658.1 398 460.1 1509.7 24.5 29 1966 36.6 753 97.8 555 30 1195.8 24.5 1967 38.6 796.3 100 418 1321.9 24.98 33 1968 42.2 868.5 106.3 525.2 1545.4 25.58 32 1969 47.9 935,5 111.1 620.7 1499.5 27.18 33 1970 58.2 9824 107.8 588.6 1469 28.72 34 1971 52 1063,4 109.6 444.4 2084.5 29 35 1972 51.2 1171.1 119.7 4273 2378.5 26.67 36 1973 59.5 1306.6 129.5 7271 2057.5 25.33 37 1974 723 1412.9 129.3 877.6 1352.5 34.06 38 1975 64.2 1528.8 117.8 $56.6 1171.4 39.79 39 1976 59.6 1700.1 129.8 780.6 1547.6 44.49 40 1972 66.8 18872 137.1 2502 1989.0 51.23 41 1978 66.5 2127.6 145.2 7095 2023.3 54.42 42 1979 98.3 2628.9 152.5 9352 1749.2 61.01 1980 1014 26331 147.1 940.9 1298.5 70.87 46 45 46 47 43 49 50 51 52 53 55 Question 2 Tablo 11.5 Question 3 Table 12.9 Question 4 7.3 Question 5 12.7 Using the data from table 12.7 (Module 4, Week 4 Data Sets and Exercises), conduct recursive least squares on the model Ceintercept+BsA+ for the periods 1950-1955, 1950-1960;1950-1965; 1950-1970; 1950-1975; and 1950-1980 to determine if there is parameter stability. A 1 Table 12.7 2 Determinants of U.S. Domestic Price of Copper, 1951-1980 3 4 YEAR = Year 5 C-Twelve Month AverageU.S. Domestic Price of Copper, Cents Per Pound 6 G Annual Gross National Product, Bilions of $ 7 1 Twelve-Month AverageIndex of Industrial Production BL Twelve Month Averagelondon Metal Exchange Price of Copper, Pounds Sterling OH - Number of Housing Starts perYear, Thousands ofUnits 10 A Twelve-Month AveragePrice of Aluminum, Cents Per Pound 11 12 13 YEAR G 1 L H A 14 1951 21.89 330.2 45.1 220.4 1491 19 15 1952 22:29 347.2 50.9 259.5 1504 16 19.41 1953 19.63 366.1 533 256.3 1438 20.93 17 1954 22.85 366.3 53.6 249.3 1551 21.78 18 1955 33.77 399.3 54.6 3523 1646 23.68 19 1956 39.18 420.2 61.1 329.1 20 1349 26.01 1957 30.58 442 61.9 219.6 1224 27.52 21 1958 26.3 447 57.9 234.8 1382 26.89 22 1959 30.7 483 64.8 237.4 1553.7 26.85 23 1960 32.1 506 66.2 245.8 1296.1 27,23 24 1961 30 5233 66.7 229.2 1365 25.46 25 1962 30.8 563.8 72.2 233.9 1492.5 26 23.38 1963 30.8 594.7 76.5 234.2 1634.9 22.62 27 1964 32.6 635.7 81.7 347 1561 23.72 28 1955 35.4 658.1 398 460.1 1509.7 24.5 29 1966 36.6 753 97.8 555 30 1195.8 24.5 1967 38.6 796.3 100 418 1321.9 24.98 33 1968 42.2 868.5 106.3 525.2 1545.4 25.58 32 1969 47.9 935,5 111.1 620.7 1499.5 27.18 33 1970 58.2 9824 107.8 588.6 1469 28.72 34 1971 52 1063,4 109.6 444.4 2084.5 29 35 1972 51.2 1171.1 119.7 4273 2378.5 26.67 36 1973 59.5 1306.6 129.5 7271 2057.5 25.33 37 1974 723 1412.9 129.3 877.6 1352.5 34.06 38 1975 64.2 1528.8 117.8 $56.6 1171.4 39.79 39 1976 59.6 1700.1 129.8 780.6 1547.6 44.49 40 1972 66.8 18872 137.1 2502 1989.0 51.23 41 1978 66.5 2127.6 145.2 7095 2023.3 54.42 42 1979 98.3 2628.9 152.5 9352 1749.2 61.01 1980 1014 26331 147.1 940.9 1298.5 70.87 46 45 46 47 43 49 50 51 52 53 55 Question 2 Tablo 11.5 Question 3 Table 12.9 Question 4 7.3 Question 5 12.7
Step by Step Solution
There are 3 Steps involved in it

Get step-by-step solutions from verified subject matter experts