

Question: Using the data from Task 3, calculate the following: Find Diagram Solution Confidence Interval: (a) Construct a two- sided 95% confidence interval for the population

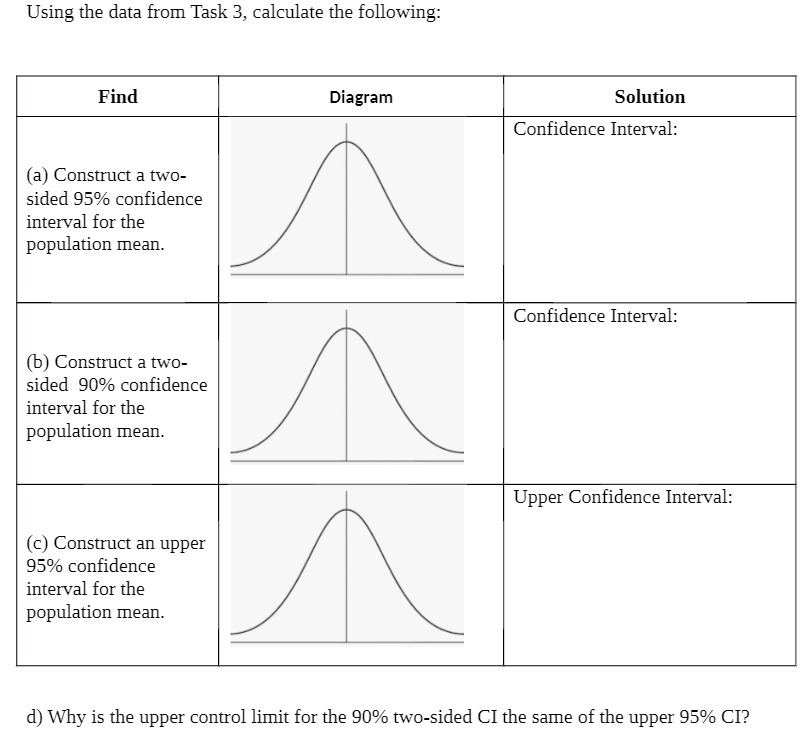
Using the data from Task 3, calculate the following: Find Diagram Solution Confidence Interval: (a) Construct a two- sided 95% confidence interval for the population mean. Confidence Interval: (b) Construct a two- sided 90% confidence interval for the population mean. Upper Confidence Interval: (c) Construct an upper 95% confidence interval for the population mean. d) Why is the upper control limit for the 90% two-sided CI the same of the upper 95% CI
Step by Step Solution
There are 3 Steps involved in it
1 Expert Approved Answer
Step: 1 Unlock

Question Has Been Solved by an Expert!
Get step-by-step solutions from verified subject matter experts
Step: 2 Unlock
Step: 3 Unlock