

Question: Using the data from the class survey, I ran the following regression: Y = a + bx, where Y represents the number of times
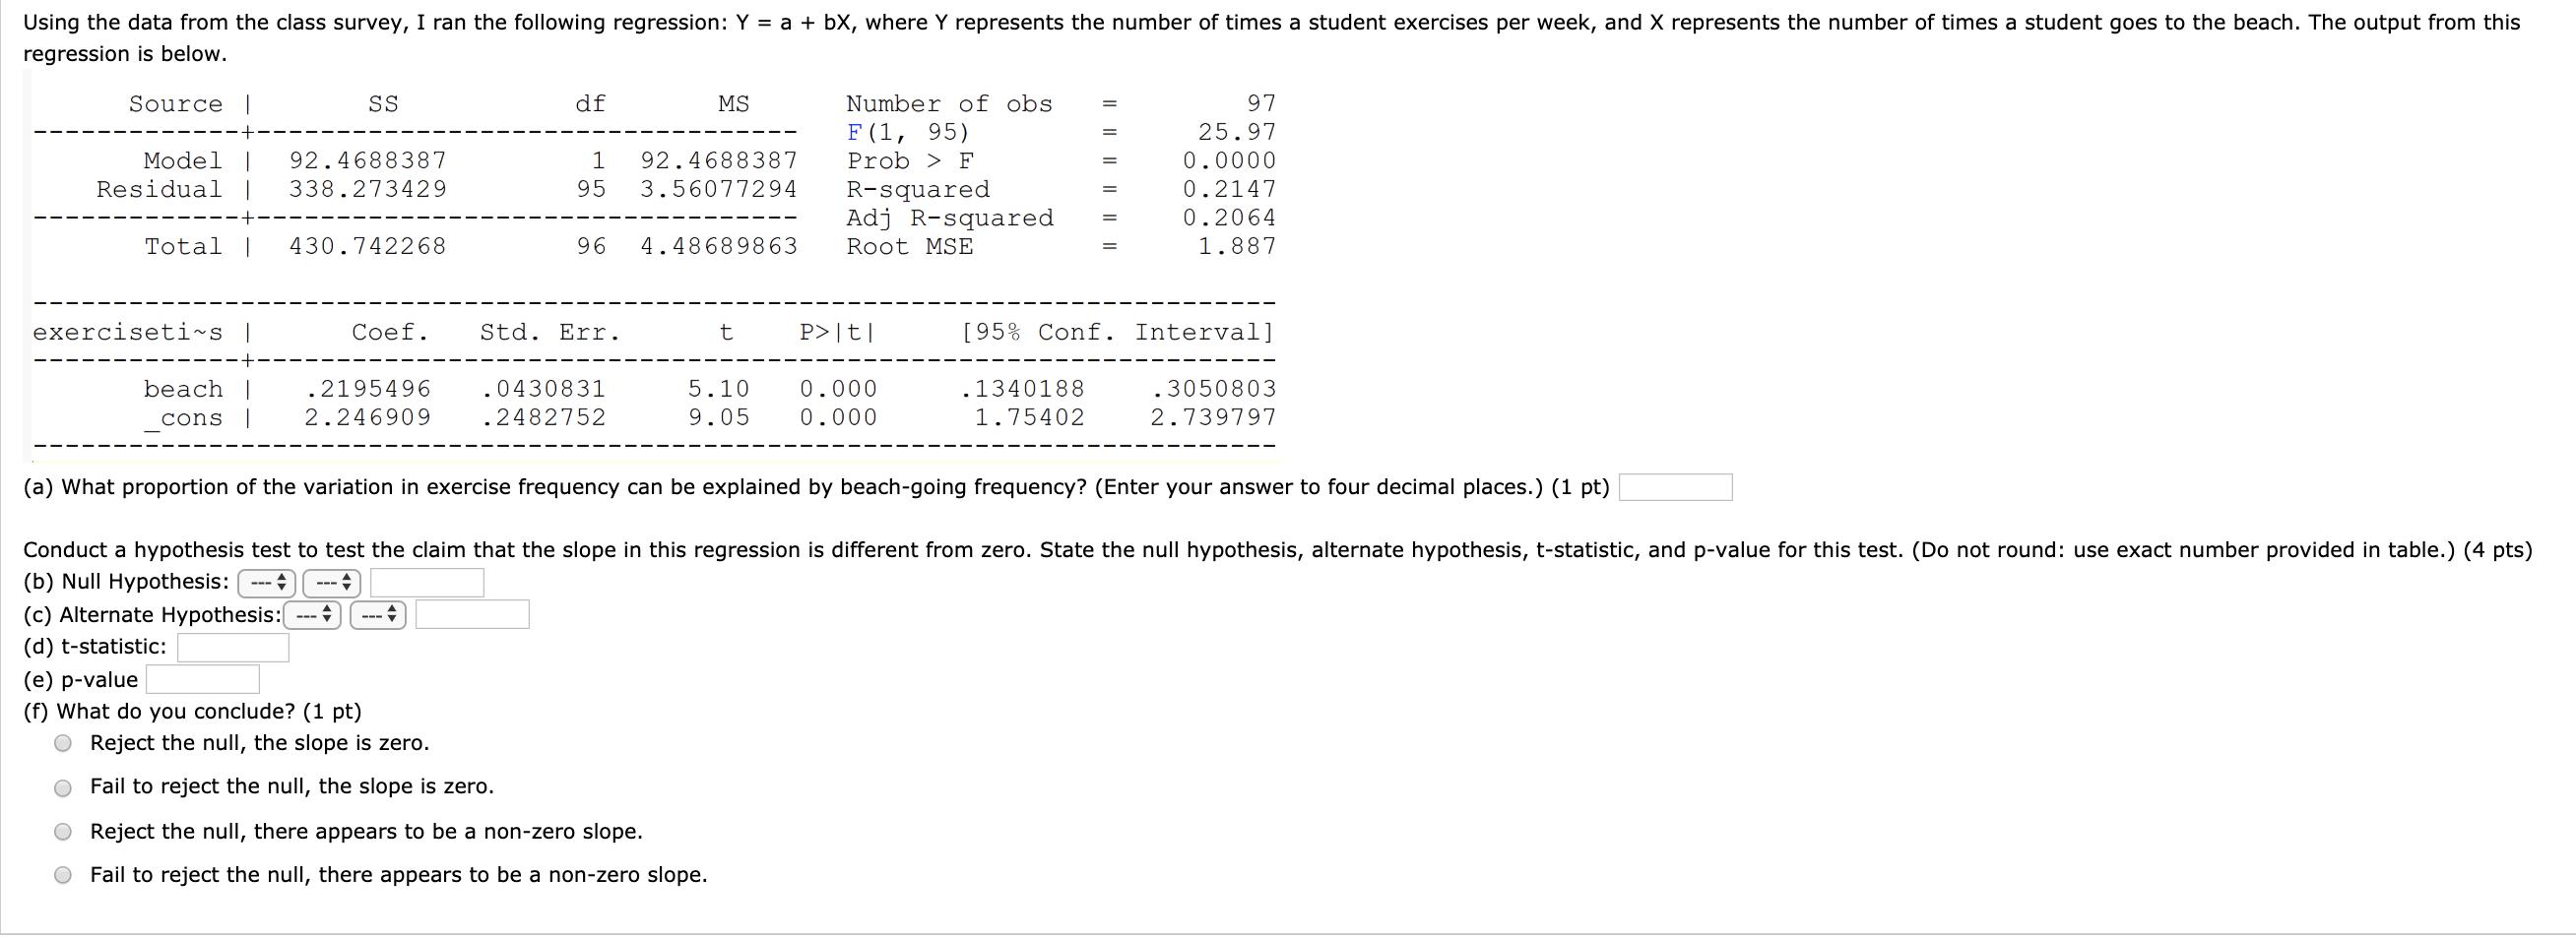
Using the data from the class survey, I ran the following regression: Y = a + bx, where Y represents the number of times a student exercises per week, and X represents the number of times a student goes to the beach. The output from this regression is below. Source Model | Residual 92.4688387 338.273429 Total I 430.742268 exerciseti~s | beach cons SS Coef. --- (e) p-value (f) What do you conclude? (1 pt) df .2195496 .0430831 2.246909 .2482752 + 1 92.4688387 95 3.56077294 96 4.48689863 Std. Err. MS t Reject the null, the slope is zero. Fail to reject the null, the slope is zero. Reject the null, there appears to be a non-zero slope. Fail to reject the null, there appears to be a non-zero slope. Number of obs F (1, 95) Prob > F R-squared Adj R-squared Root MSE P> |t| 5.10 0.000 9.05 0.000 (a) What proportion of the variation in exercise frequency can be explained by beach-going frequency? (Enter your answer to four decimal places.) (1 pt) Conduct a hypothesis test to test the claim that the slope in this regression is different from zero. State the null hypothesis, alternate hypothesis, t-statistic, and p-value for this test. (Do not round: use exact number provided in table.) (4 pts) (b) Null Hypothesis: ---- (c) Alternate Hypothesis: - (d) t-statistic: 97 25.97 0.0000 0.2147 0.2064 1.887 [95% Conf. Interval] 3050803 2.739797 .1340188 1.75402
Step by Step Solution
3.39 Rating (152 Votes )
There are 3 Steps involved in it
a Here we have only one independent variable So the proportion of variance in the exercise ... View full answer

Get step-by-step solutions from verified subject matter experts