

Question: Using the data from the Student Table down below: Devise a null and alternative hypothesis,then perform a one sample z-testusing alpha=0.05 if our class is
Using the data from the Student Table down below:
- Devise a null and alternative hypothesis,then perform a one sample z-testusing alpha=0.05 if our class is taller or shorter than the average human in the United States. Graphically display your answer and statistically write up results. In addition, determine the effect size of this relationship and interpret.
Notes:
- The average height of adults in the United States is 67.03.8 inches. (Note: this is a population SD)
- Calculate and interpret the effect size (use Cohen's d):
Cohen's d = (Msample- population) ? ?)
2) Devise a null and alternative hypothesis, then perform a t-test using alpha =0.05 if the students in our class that are born in warm weather months are taller or shorter than those born in cold weather months. Graphically display your answer and statistically write up results. In addition, determine the effect size of this relationship and interpret.
Notes:
1) Population SDs are unknown
2) Assume the northern hemisphere:
Warm months = April, May, June, July, August, September
Cold months = October, November, December, January, February, March
3) Use Cohen's d effect size:
Cohen's d = (M2- M1) ? SDpooled) where SDpooled= ?((SD12+ SD22) ? 2)
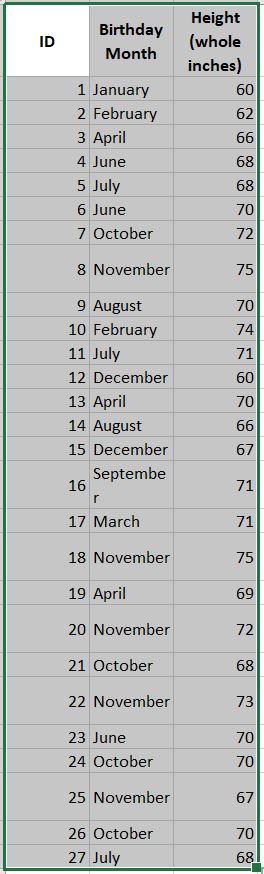
Height Birthday ID (whole Month inches) 1 January 60 2 February 62 3 April 66 4 June 68 5 July 68 6 June 70 7 October 72 8 November 75 9 August 70 10 February 74 11 July 71 12 December 60 13 April 70 14 August 66 15 December 67 Septembe 16 71 r 17 March 71 18 November 75 19 April 69 20 November 72 21 October 68 22 November 73 23 June 70 24 October 70 25 November 67 26 October 70 27 July 68
Step by Step Solution
There are 3 Steps involved in it

Get step-by-step solutions from verified subject matter experts