

Question: Using the data furnished in Problem 4-9, draw the histogram frequency distribution and cumulative percentage distribution for each set of data and determine (a) average
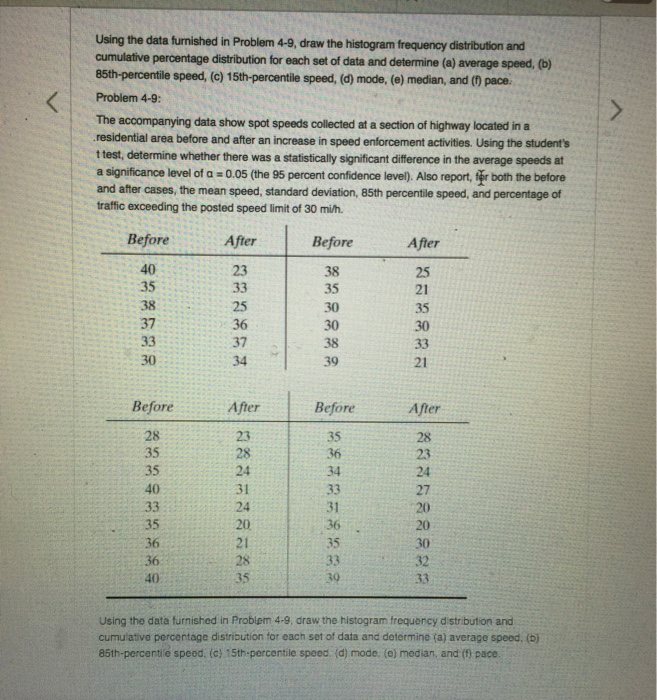
Using the data furnished in Problem 4-9, draw the histogram frequency distribution and cumulative percentage distribution for each set of data and determine (a) average speed, (b) 85th-percentile speed, (c) 15th-percentile speed, (d) mode, (e) median, and (7 pace Problem 4-9 The accompanying data show spot speeds collected at a section of highway located in a .residential area before and after an increase in speed enforcement activities. Using the student's t test, determine whether there was a statistically significant difference in the average speeds at a significance level of a 0.05 (the 95 percent confidence level). Also report, fer both the before and after cases, the mean speed, standard deviation, 85th percentile speed, and percentage of traffic exceeding the posted speed limit of 30 mi/h. Before After 23 25 37 Before After 40 25 21 35 35 37 30 35 39 21 Before 28 35 35 After Before After 23 35 24 31 24 20 21 28 35 24 27 35 32 40 Using the data furnished in Probipm 4-9, draw the histogram frequency distrbution and cumulative percentage distribution for each set of data and determine fa) average speed, (b) 85th-percentile speed. (c) 15th-percentile speed. (d) mode. (e) median, and (f) pace
Step by Step Solution
There are 3 Steps involved in it

Get step-by-step solutions from verified subject matter experts