

Question: Using the data given. Determine the relative variability of each divisions sales as compared to that of the consolidated firm. Which one is the riskiest?
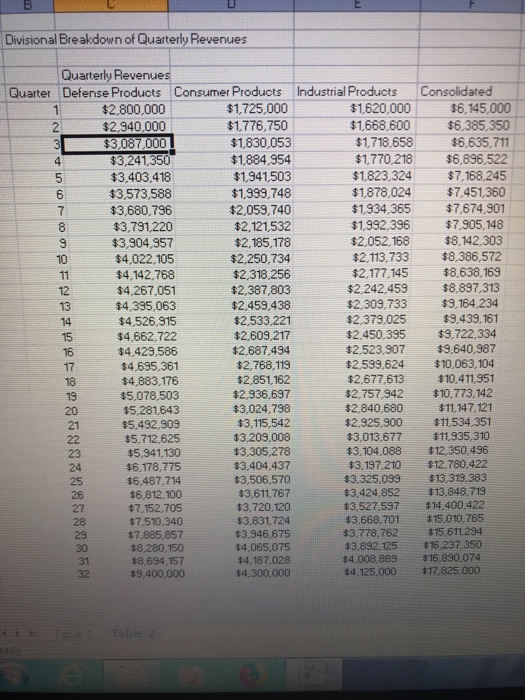
Divisional Breakdown of Quarterly Revenues Quarter Defense Products Consumer Products Industrial Products Consolidated 1$2,800,000 $1,725,000 $1,776,750 $1,620,000 $6,145 1,668,600 $6.385.350 1,718,658 $6,635,711 1,770,218 $6,896,522 $1,823,324 $1,999,748 $2,059,740 $3,573,588 $3,680,796 $3,791,220 $3,904,957 $4,022,105 $4,142,768 $4,267,051 $4,395,063 1.934,365 $7674,901 $1,992,396 $7.905,148 $2.052,168 $8,142,303 $2,185,178 $2,318.256 $2,459,438 $2,113,733 $8,386,572 $2,177,145 $2,242,459 $8,897,313 $2,309,733 $9,164,234 $2,609.217 494 $2,768,119 $2,450,395 $9,722,334 $4,662,722 $4.429,586 $2,599,624 $10,063,104 $2,677,613 $2,757,942 $10.773,142 $4,883,176 $10.411,951 $2,936,697 $3,024,798 $3,115,542 $3,209,008 $3,305,278 $5,281643 $2.925,300$11,534.351 $3,013,677 $11,935,310 $3,104,088 $12,350,496 $3.197,210 $12.780 422 $3,325,099 $13,319,383 $3,424,852 $13.848,713 $3,527.597 14,.400,422 $3,668.701 $15,010,765 $3.778,762 $15.611,294 $3,892 125 $16,237,350 $4,008,889 $16,830074 $5,941,130 $6,178,779 $6,487,714 $3,506.570 $3,611,767 $3,720.120 $3,831,724 $7.152,7095 $7,510.340 $8,280,150 $4,300,000
Step by Step Solution
There are 3 Steps involved in it

Get step-by-step solutions from verified subject matter experts