

Question: Using the Data: How would you describe the shape of the yield curve you created in this case study?How would an inverted yield curve be
Using the Data:
How would you describe the shape of the yield curve you created in this case study?How would an inverted yield curve be different and what might that indicate about the market and economy?
What is the difference between coupon rates and yield to maturity, and how do these differences impact bond prices?
Why are long-term bond prices more volatile than short-term bond prices?
How might the yield to maturity change for an organization in the event of a credit upgrade or downgrade by rating agencies?
Fixed income securities are generally considered less volatile than equity securities.Why do high-yield bonds more closely resemble equity volatility?
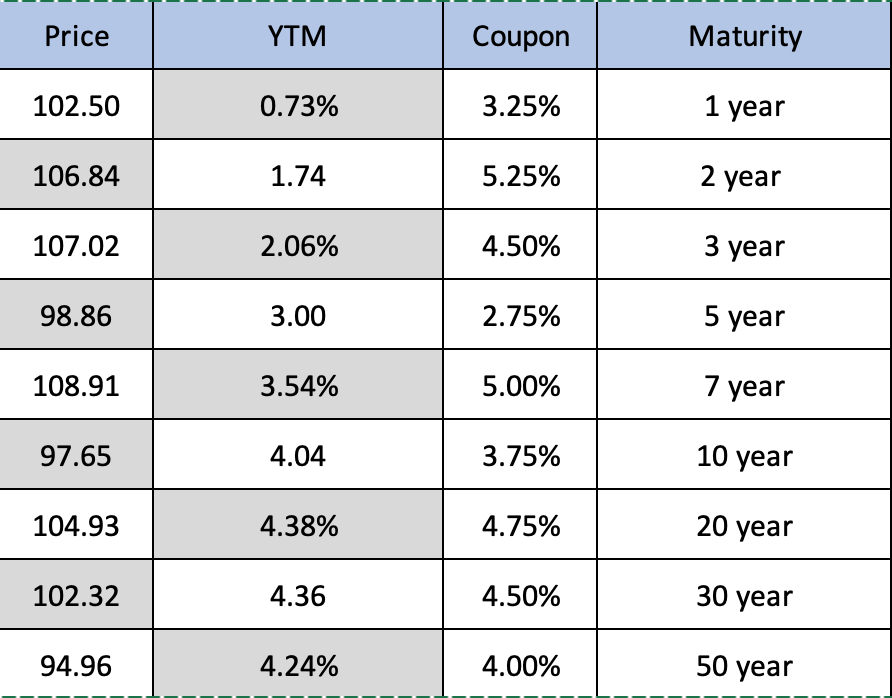
Price YTM Coupon Maturity 102.50 0.73% 3.25% 1 year 106.84 1.74 5.25% 2 year 107.02 2.06% 4.50% 3 year 98.86 3.00 2.75% 5 year 108.91 3.54% 5.00% 7 year 97.65 4.04 3.75% 10 year 104.93 4.38% 4.75% 20 year 102.32 4.36 4.50% 30 year 94.96 4.24% 4.00% 50 year
Step by Step Solution
There are 3 Steps involved in it

Get step-by-step solutions from verified subject matter experts