

Question: Using the data in Table Q6.2, assume a first-order with dead time process and apply Method I and Method II to obtain an empirical model
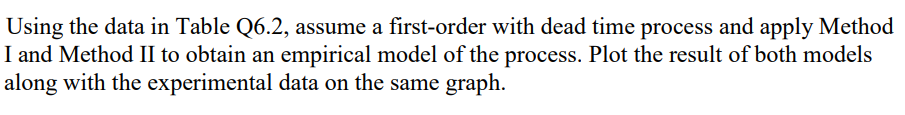
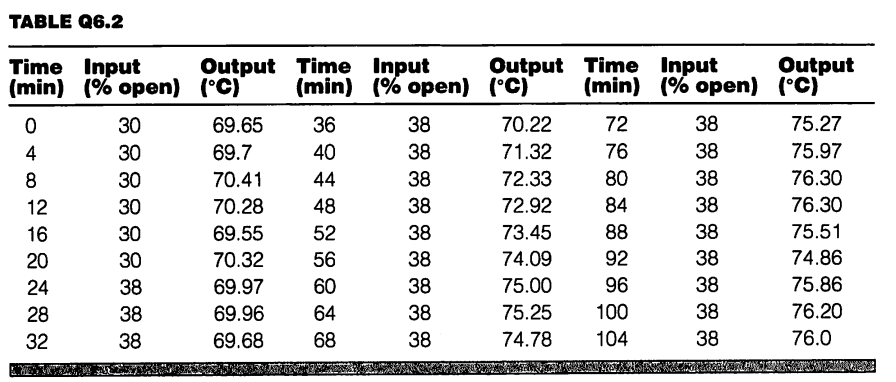
Using the data in Table Q6.2, assume a first-order with dead time process and apply Method I and Method II to obtain an empirical model of the process. Plot the result of both models along with the experimental data on the same graph. TABLE Q6.2 O 00 Time Input Output Time Input Output Time Input Output (min) (% open) (C) (min) % open) (C) (min) (% open) (C) 30 69.65 36 38 70.22 72 38 75.27 4 30 69.7 40 38 71.32 76 38 75.97 8 30 70.41 44 38 72.33 80 38 76.30 12 30 70.28 48 38 72.92 84 38 76.30 16 30 69.55 52 38 73.45 88 38 75.51 20 30 70.32 56 38 74.09 92 38 74.86 24 38 69.97 60 38 75.00 96 38 75.86 28 38 69.96 64 38 75.25 100 38 76.20 32 38 69.68 68 38 74.78 104 38 76.0 Using the data in Table Q6.2, assume a first-order with dead time process and apply Method I and Method II to obtain an empirical model of the process. Plot the result of both models along with the experimental data on the same graph. TABLE Q6.2 O 00 Time Input Output Time Input Output Time Input Output (min) (% open) (C) (min) % open) (C) (min) (% open) (C) 30 69.65 36 38 70.22 72 38 75.27 4 30 69.7 40 38 71.32 76 38 75.97 8 30 70.41 44 38 72.33 80 38 76.30 12 30 70.28 48 38 72.92 84 38 76.30 16 30 69.55 52 38 73.45 88 38 75.51 20 30 70.32 56 38 74.09 92 38 74.86 24 38 69.97 60 38 75.00 96 38 75.86 28 38 69.96 64 38 75.25 100 38 76.20 32 38 69.68 68 38 74.78 104 38 76.0
Step by Step Solution
There are 3 Steps involved in it

Get step-by-step solutions from verified subject matter experts