

Question: Using the data in the following table, and the fact that the correlation of A and B is 0.43, calculate the volatility (standard deviation) of
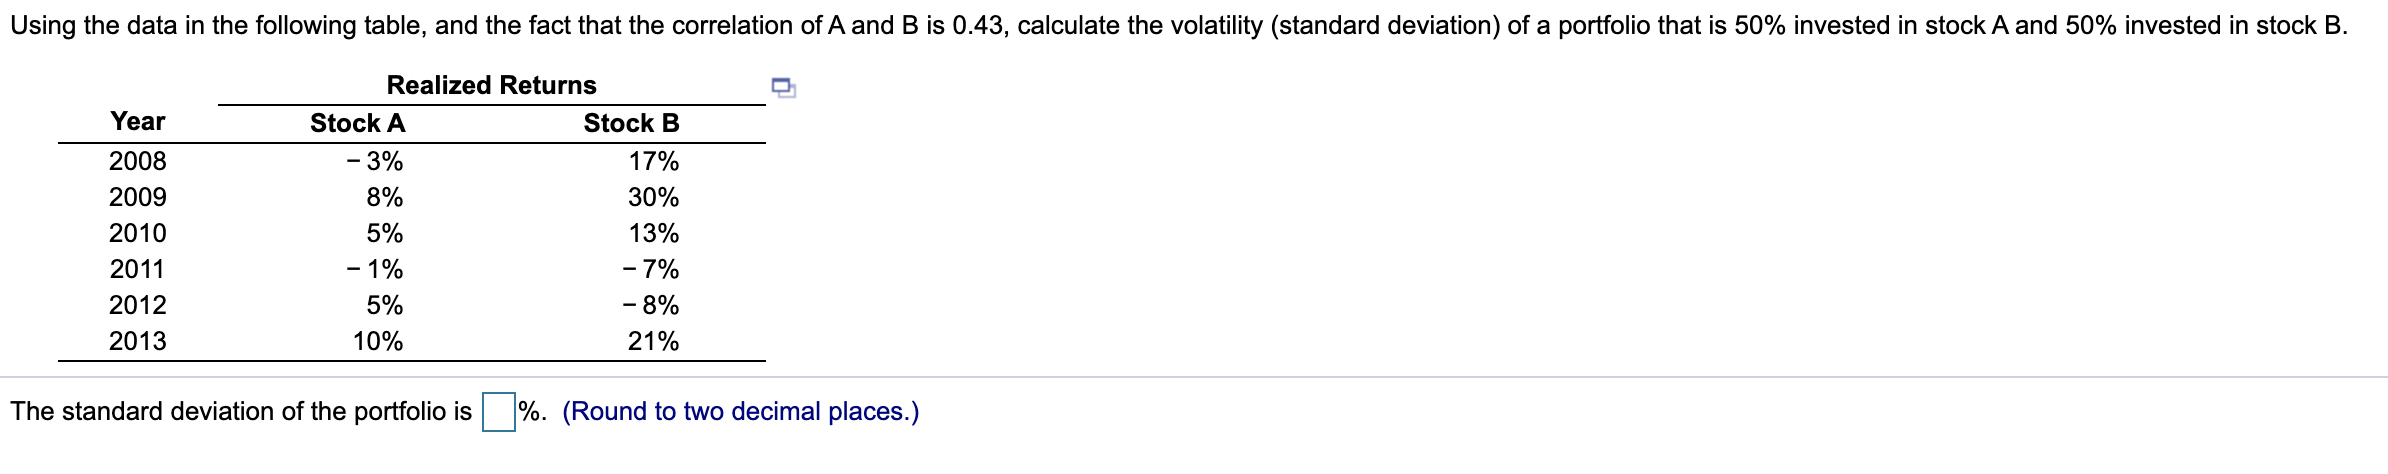
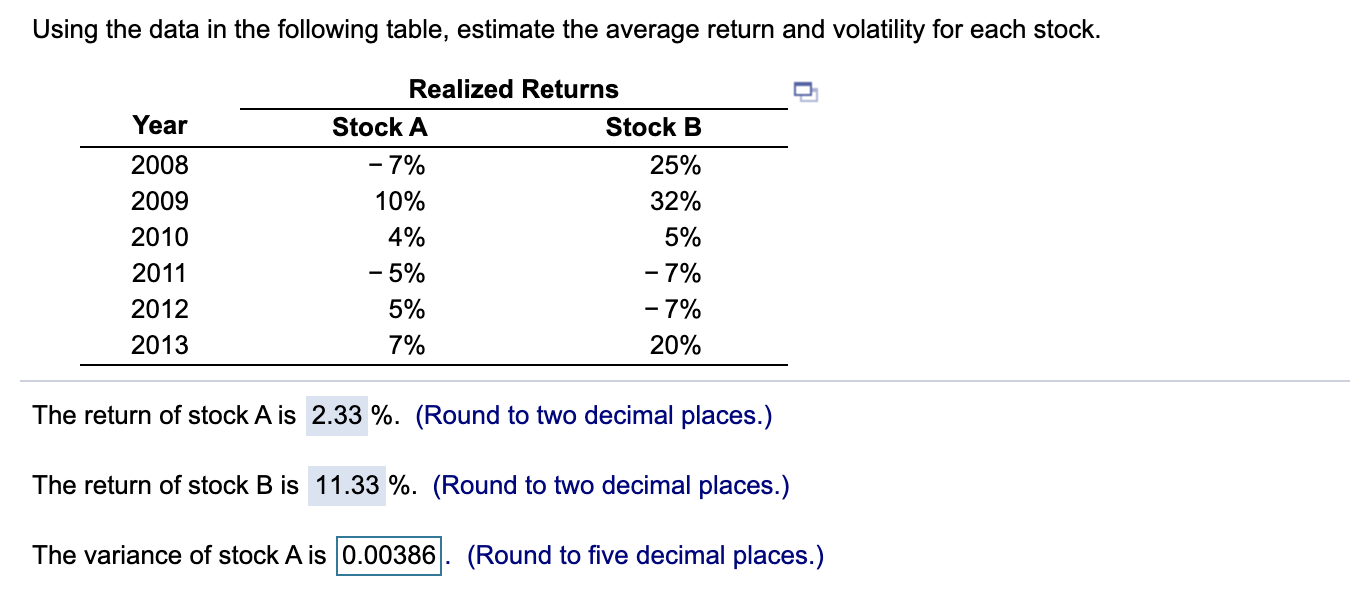
Using the data in the following table, and the fact that the correlation of A and B is 0.43, calculate the volatility (standard deviation) of a portfolio that is 50% invested in stock A and 50% invested in stock B. Year 2008 2009 2010 2011 2012 2013 Realized Returns Stock A Stock B -3% 17% 8% 30% 5% 13% - 1% -7% 5% -8% 10% 21% The standard deviation of the portfolio is %. (Round to two decimal places.) Using the data in the following table, estimate the average return and volatility for each stock. Year 2008 2009 2010 2011 2012 2013 Realized Returns Stock A Stock B -7% 25% 10% 32% 4% 5% -5% -7% 5% -7% 7% 20% The return of stock A is 2.33 %. (Round to two decimal places.) The return of stock B is 11.33 %. (Round to two decimal places.) The variance of stock A is 0.00386 (Round to five decimal places.)
Step by Step Solution
There are 3 Steps involved in it

Get step-by-step solutions from verified subject matter experts