

Question: Using the data in the following table, and the fact that the correlation of A and B is 0.43, calculate the volatility (standard deviation) of
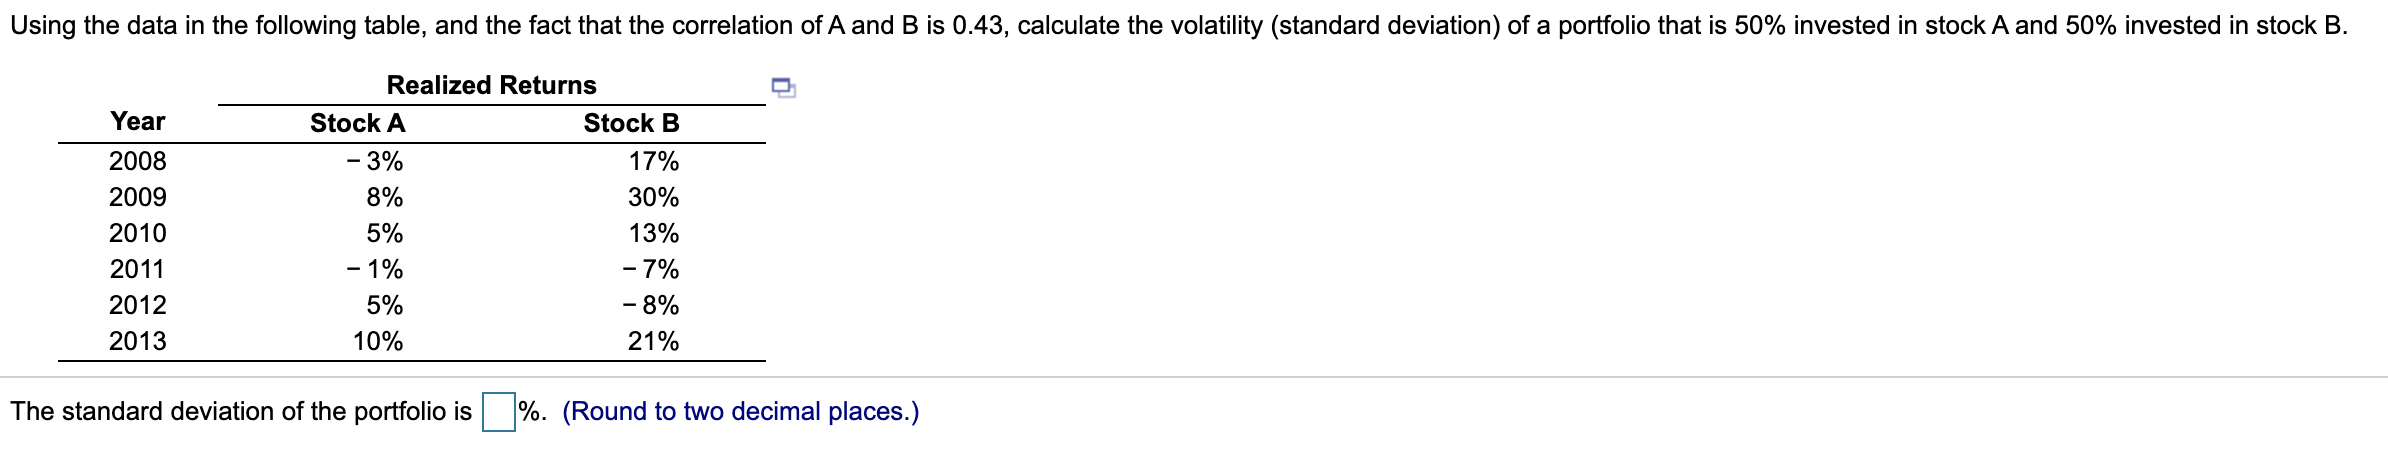
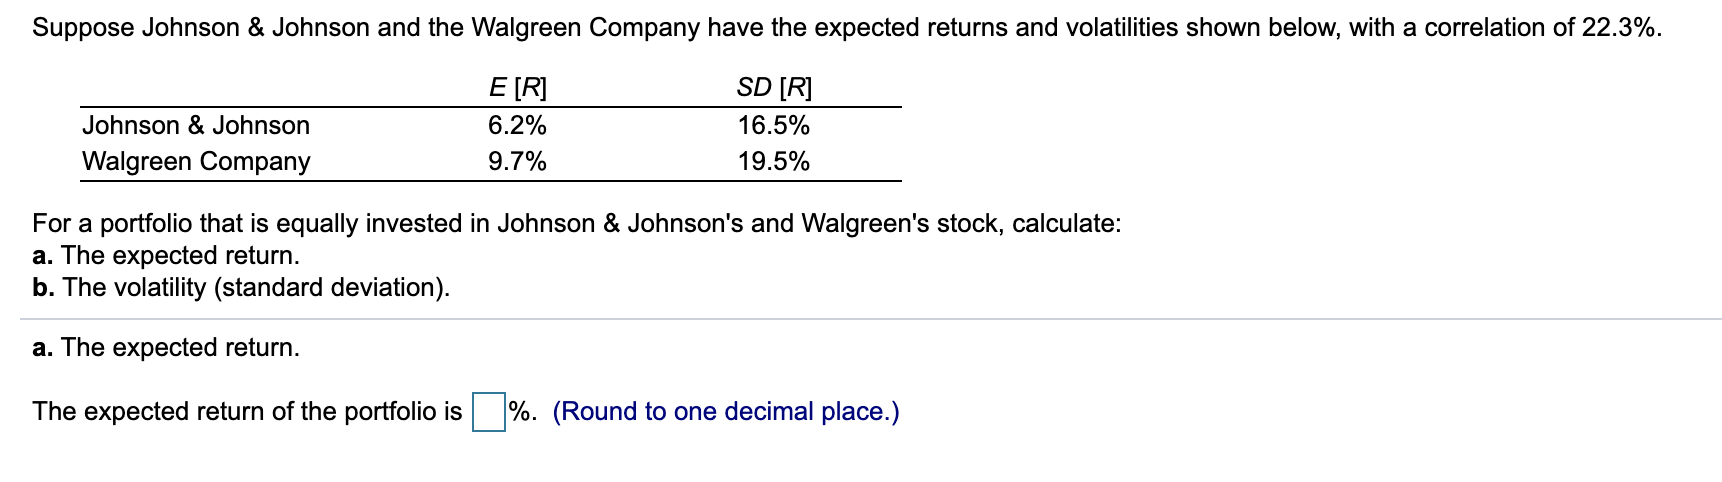
Using the data in the following table, and the fact that the correlation of A and B is 0.43, calculate the volatility (standard deviation) of a portfolio that is 50% invested in stock A and 50% invested in stock B. Year 2008 2009 2010 2011 2012 2013 Realized Returns Stock A Stock B -3% 17% 8% 30% 5% 13% - 1% -7% 5% -8% 10% 21% The standard deviation of the portfolio is %. (Round to two decimal places.) Suppose Johnson & Johnson and the Walgreen Company have the expected returns and volatilities shown below, with a correlation of 22.3%. SD [R] Johnson & Johnson Walgreen Company E[R] 6.2% 9.7% 16.5% 19.5% For a portfolio that is equally invested in Johnson & Johnson's and Walgreen's stock, calculate: a. The expected return. b. The volatility (standard deviation). a. The expected return. The expected return of the portfolio is %. (Round to one decimal place.)
Step by Step Solution
There are 3 Steps involved in it

Get step-by-step solutions from verified subject matter experts