

Question: Using the data in the following table, and the fact that the correlation of A and B is 0.19, calculate the volatility (standard deviation)
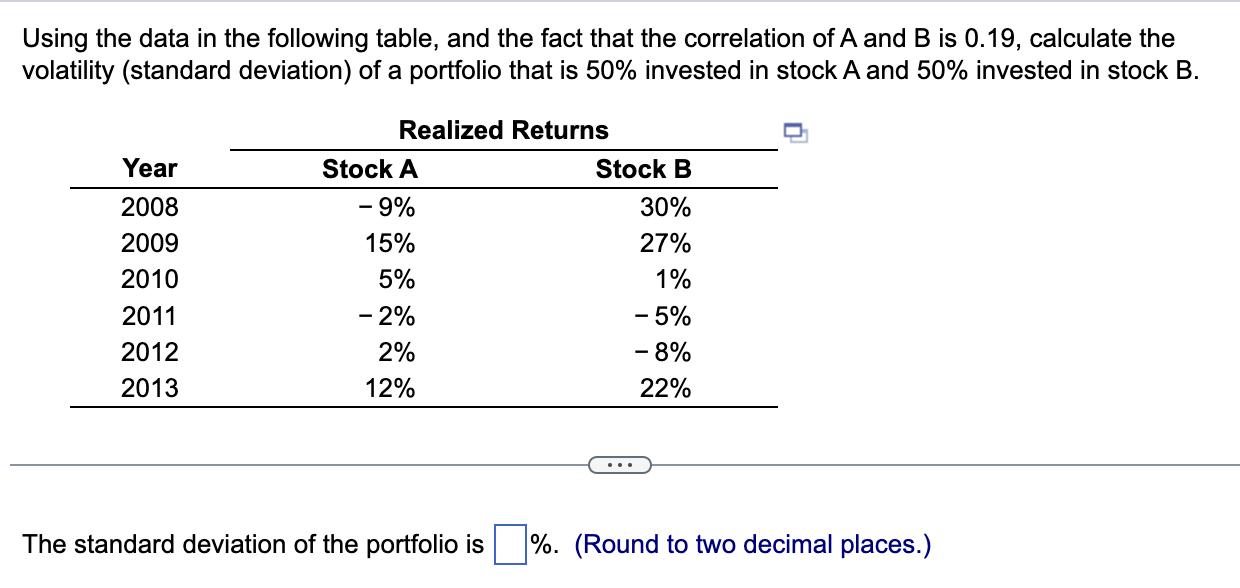
Using the data in the following table, and the fact that the correlation of A and B is 0.19, calculate the volatility (standard deviation) of a portfolio that is 50% invested in stock A and 50% invested in stock B. Realized Returns Year 2008 2009 2010 2011 2012 2013 Stock A - 9% 15% 5% - 2% 2% 12% Stock B 30% 27% 1% - 5% - 8% 22% The standard deviation of the portfolio is%. (Round to two decimal places.)
Step by Step Solution
3.35 Rating (164 Votes )
There are 3 Steps involved in it
To calculate the standard deviation of the portfolio we can follow these steps 1 Calculate the weigh... View full answer

Get step-by-step solutions from verified subject matter experts