

Question: Using the data in the following table, and the fact that the correlation of A and B is 0.48, calculate the volatility (standard deviation)
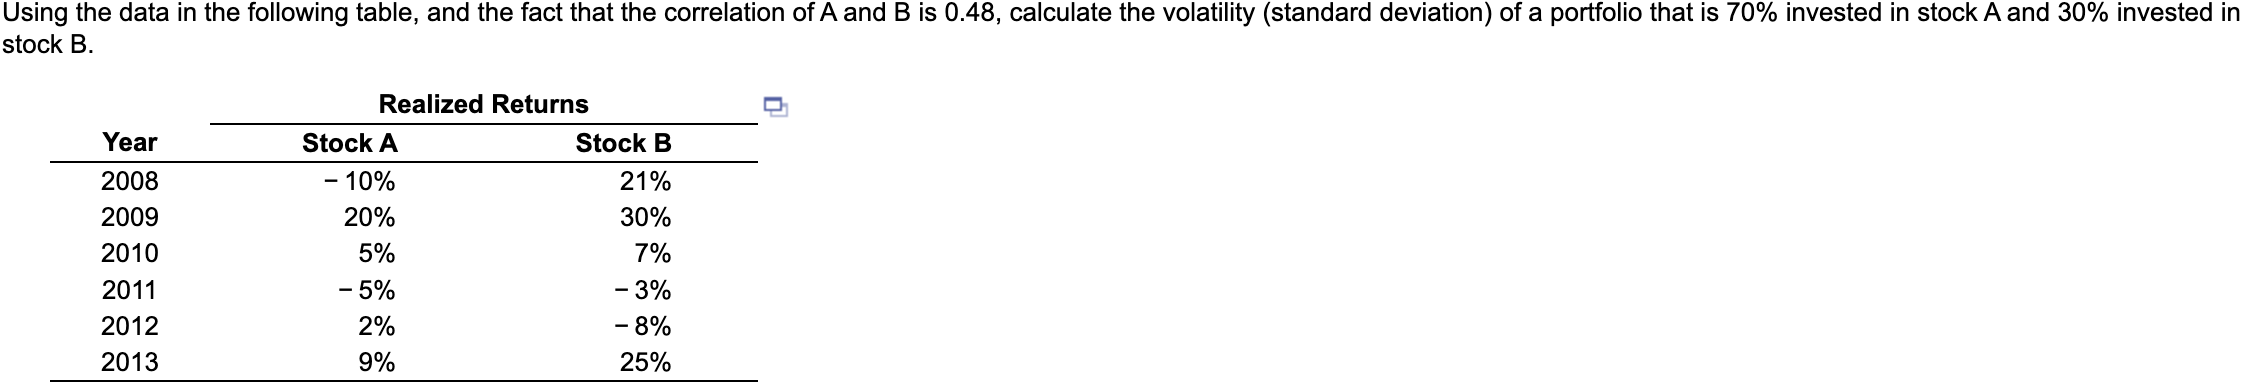
Using the data in the following table, and the fact that the correlation of A and B is 0.48, calculate the volatility (standard deviation) of a portfolio that is 70% invested in stock A and 30% invested in stock B. Year 2008 2009 2010 2011 2012 2013 Realized Returns Stock A - 10% 20% 5% - 5% 2% 9% Stock B 21% 30% 7% - 3% - 8% 25%
Step by Step Solution
There are 3 Steps involved in it
1 Expert Approved Answer
Step: 1 Unlock

Question Has Been Solved by an Expert!
Get step-by-step solutions from verified subject matter experts
Step: 2 Unlock
Step: 3 Unlock