

Question: Using the data in the following table, calculate the volatility (standard deviation) of a portfolio that is 69% invested in stock A and 31% in
Using the data in the following table,
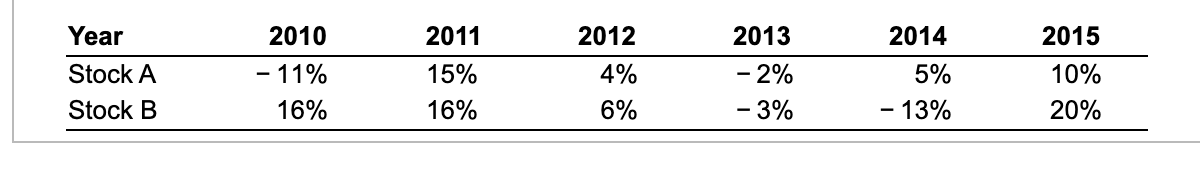
calculate the volatility (standard deviation) of a portfolio that is 69% invested in stock A and 31% in stock B.
\begin{tabular}{lrrrrrr} Year & 2010 & 2011 & 2012 & 2013 & 2014 & 2015 \\ \hline Stock A & 11% & 15% & 4% & 2% & 5% & 10% \\ Stock B & 16% & 16% & 6% & 3% & 13% & 20% \\ \hline \end{tabular}
Step by Step Solution
There are 3 Steps involved in it
1 Expert Approved Answer
Step: 1 Unlock

Question Has Been Solved by an Expert!
Get step-by-step solutions from verified subject matter experts
Step: 2 Unlock
Step: 3 Unlock