

Question: Using the data in the following table. . consider a portfolio that maintains a 30% weight on stock A and a 70% weight on stock
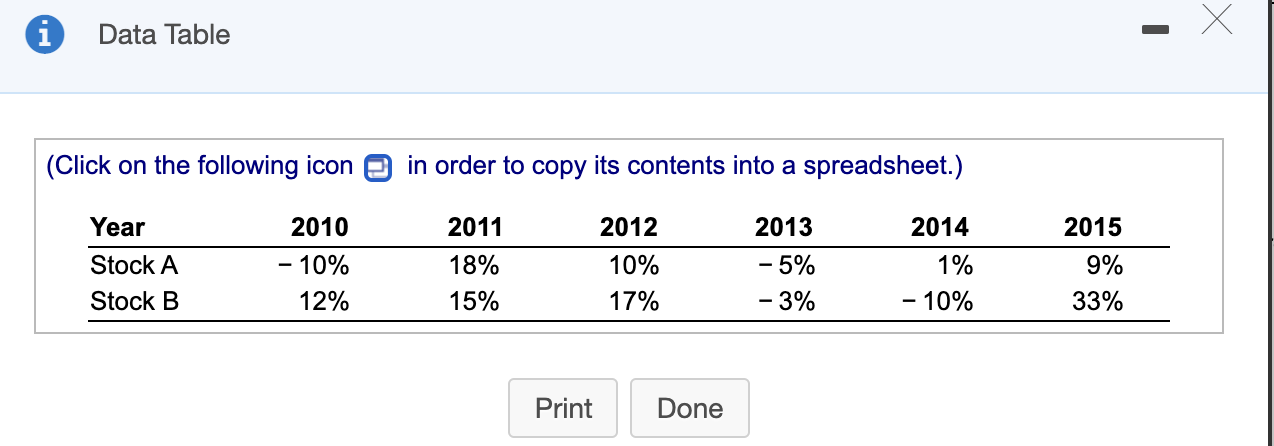
Using the data in the following table. . consider a portfolio that maintains a 30% weight on stock A and a 70% weight on stock B. a. What is the return each year of this portfolio? b. Based on your results from part (a), compute the average return and volatility of the portfolio c. Show that 0) the average return of the portfolio is equal to the (weighted) average of the average returns of the two stocks, and (ii) the volatility of the portfolio equals the same result as from the calculation in Eq. 11.9. d. Explain why the portfolio has a lower volatility than the average volatility of the two stocks. a. What is the return each year of this portfolio? Enter the return of this portfolio for each year in the table below. (Round to two decimal places.) Year 2010 2011 2013 2014 Portfolio % % % 2012 2015 b. Based on your results from part (a), compute the average return and volatility of the portfolio The average retum of the portfolio is%. (Round to two decimal places.) The volatility of the portfolio is %. (Round to two decimal places.) c. Show that (1) the average return of the portfolio is equal to the weighted) average of the average returns of the two stocks, and (II) the volatility of the portfolio equals the same result as from the calculation in Eq. 11.9. The average annual return for stock Ais%. (Round to two decimal places.) The average annual return for stock Bis%. (Round to two decimal places.) The weighted average of the average returns of the two stocks is % (Round to two decimal places.) The volatility of the portfolio is % (Round to two decimal places.) d. Explain why the portfolio has a lower volatility than the average volatility of the two stocks. (Select from the drop-down menu.) The portfolio has a volatility than the average volatility of the two stocks because some of the idiosyncratic risk of the stocks in the portfolio is diversified away. X - Data Table (Click on the following icon e in order to copy its contents into a spreadsheet.) 2013 2015 Year Stock A Stock B 2010 - 10% 12% 2011 18% 15% 2012 10% 17% 2014 1% 10% -5% -3% 9% 33% Print Done
Step by Step Solution
There are 3 Steps involved in it

Get step-by-step solutions from verified subject matter experts