

Question: Using the data in the following table, , estimate the average return and volatility for each stock. The return of stock A is 2 .
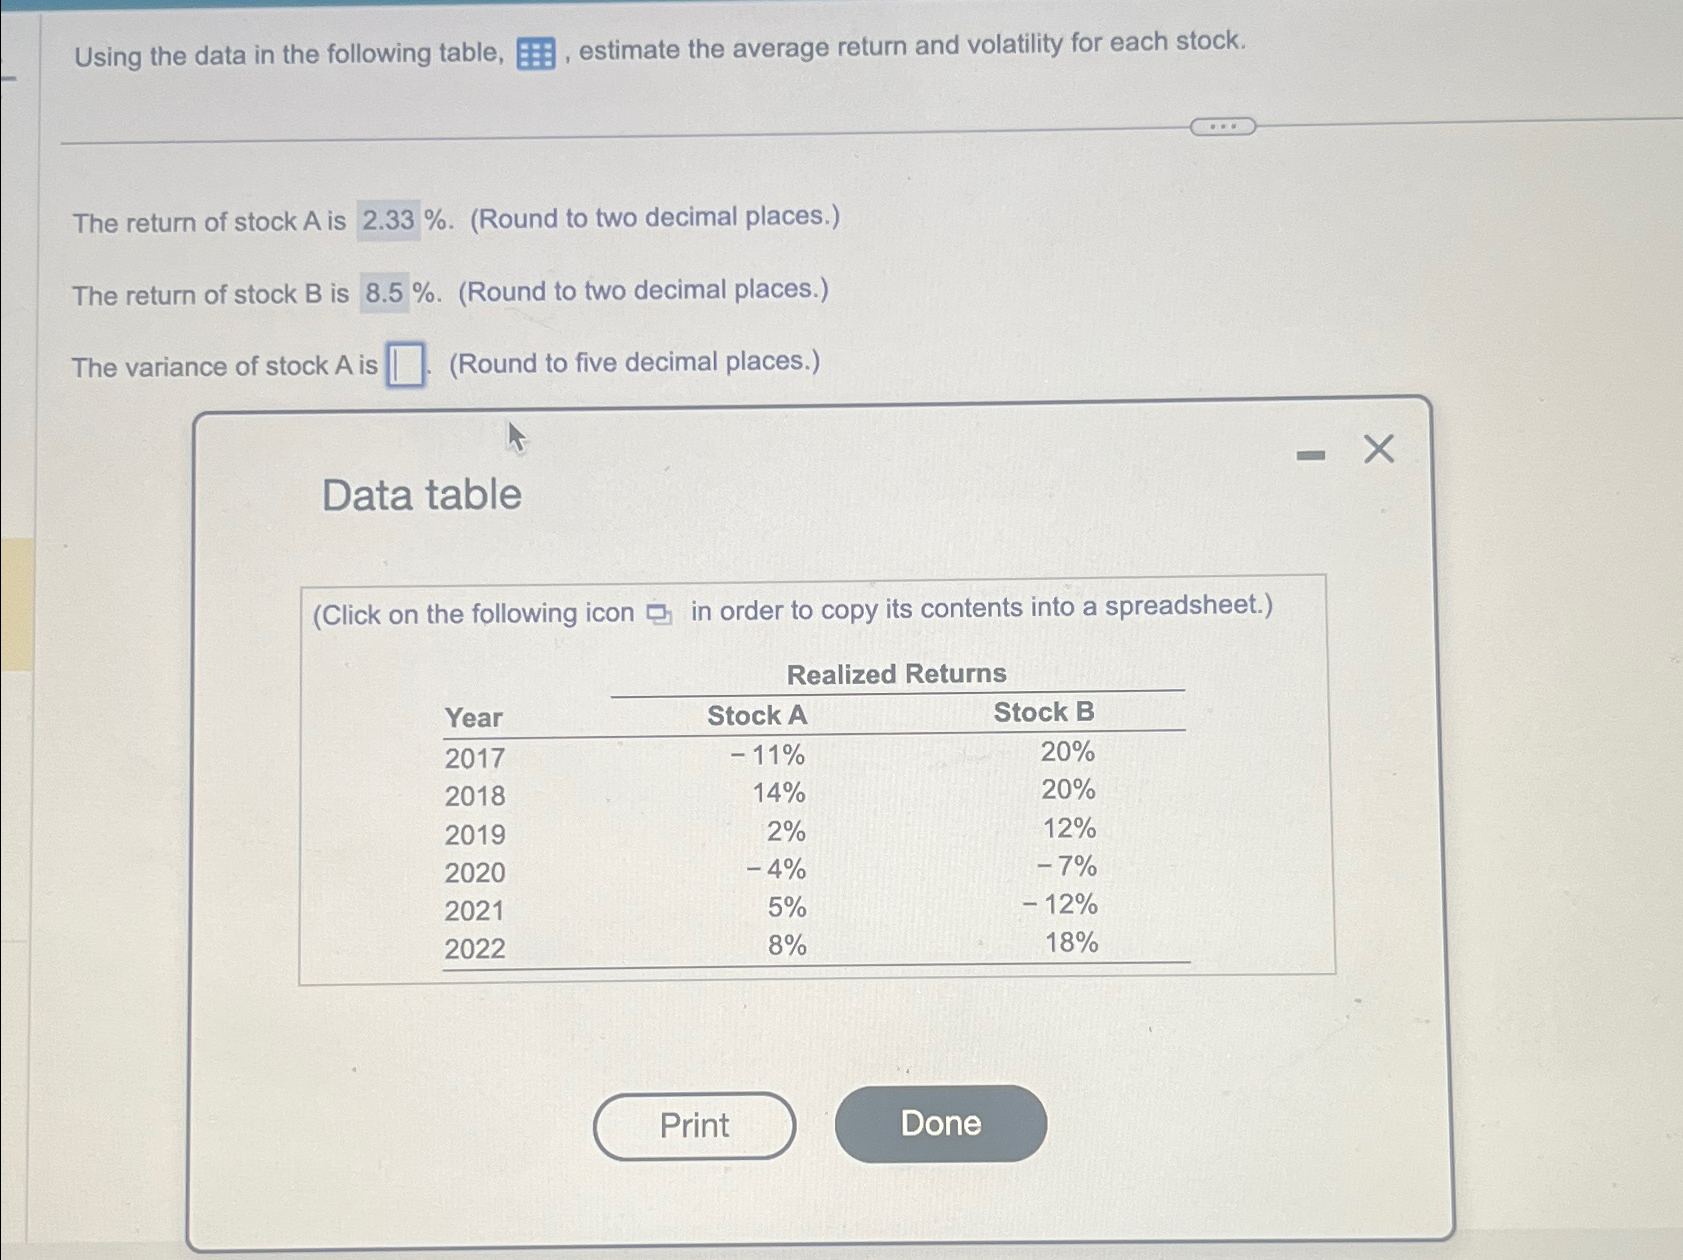
Using the data in the following table, estimate the average return and volatility for each stock.
The return of stock is Round to two decimal places.
The return of stock B is Round to two decimal places.
The variance of stock is Round to five decimal places.
Data table
Click on the following icon in order to copy its contents into a spreadsheet.
tableRealized ReturnsYearStock AStock B
Please explain the Volatility of both stocks A & B
Step by Step Solution
There are 3 Steps involved in it
1 Expert Approved Answer
Step: 1 Unlock

Question Has Been Solved by an Expert!
Get step-by-step solutions from verified subject matter experts
Step: 2 Unlock
Step: 3 Unlock