

Question: Using the data in the following table, estimate the average return and volatility for each stock. (Click on the following icon 2 in order to
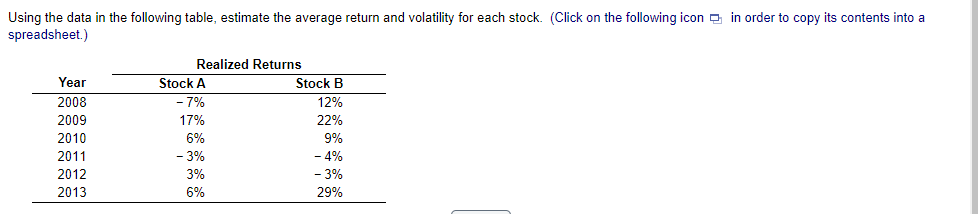
Using the data in the following table, estimate the average return and volatility for each stock. (Click on the following icon 2 in order to copy its contents into a spreadsheet.) Year 2008 2009 2010 2011 2012 2013 Realized Returns Stock A Stock B -7% 12% 17% 22% 6% 9% - 3% - 4% 3% - 3% 6% 29%
Step by Step Solution
There are 3 Steps involved in it
1 Expert Approved Answer
Step: 1 Unlock

Question Has Been Solved by an Expert!
Get step-by-step solutions from verified subject matter experts
Step: 2 Unlock
Step: 3 Unlock