

Question: Using the data in the following table, estimate the average return and volatility for each stock. Realized Returns Year Stock A Stock B 2008 -
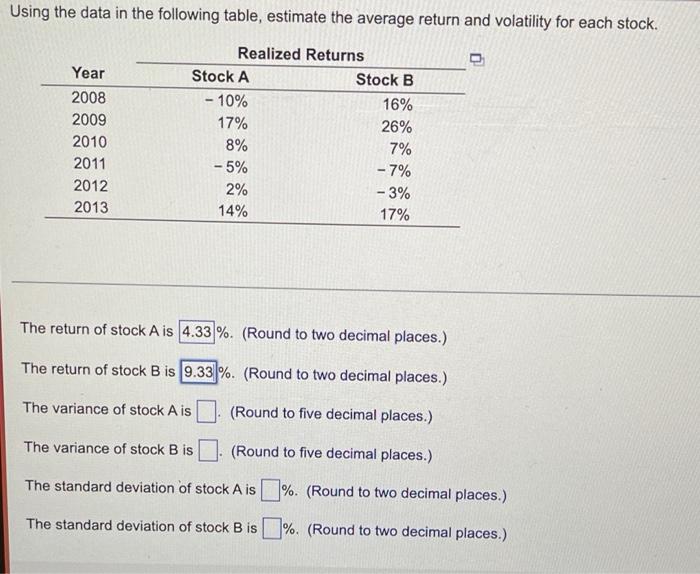
Using the data in the following table, estimate the average return and volatility for each stock. Realized Returns Year Stock A Stock B 2008 - 10% 16% 2009 17% 26% 2010 8% 7% 2011 - 5% -7% 2012 2% - 3% 2013 14% 17% The return of stock A is 4.33 %. (Round to two decimal places.) The return of stock B is 9.33 %. (Round to two decimal places.) The variance of stock A is (Round to five decimal places.) The variance of stock B is. (Round to five decimal places.) The standard deviation of stock A is%. (Round to two decimal places.) The standard deviation of stock B is %. (Round to two decimal places.)
Step by Step Solution
There are 3 Steps involved in it
1 Expert Approved Answer
Step: 1 Unlock

Question Has Been Solved by an Expert!
Get step-by-step solutions from verified subject matter experts
Step: 2 Unlock
Step: 3 Unlock