

Question: Using the data in the table below, determine the a) mean, and variance, b) frequency as a function of the response, c) number affected as
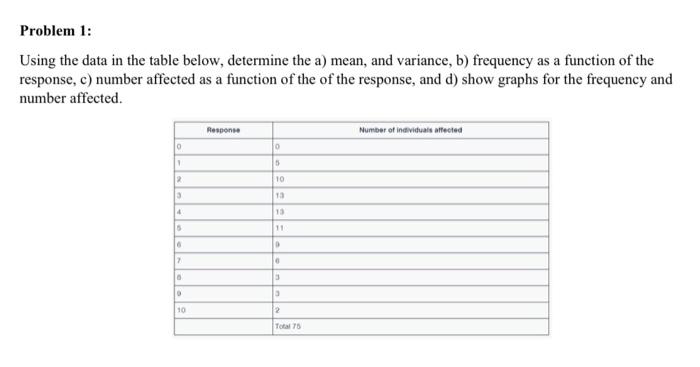
Using the data in the table below, determine the a) mean, and variance, b) frequency as a function of the response, c) number affected as a function of the of the response, and d) show graphs for the frequency and number affected
Step by Step Solution
There are 3 Steps involved in it
1 Expert Approved Answer
Step: 1 Unlock

Question Has Been Solved by an Expert!
Get step-by-step solutions from verified subject matter experts
Step: 2 Unlock
Step: 3 Unlock