

Question: Using the data provided in Example 2-1, determine (a) the mean and variance, (b) the frequency as a function of the response, and (c) the
Using the data provided in Example 2-1, determine
(a) the mean and variance,
(b) the frequency as a function of the response, and
(c) the number affected as a function of the response. Also,
(d) show graphs for the frequency and number affected.
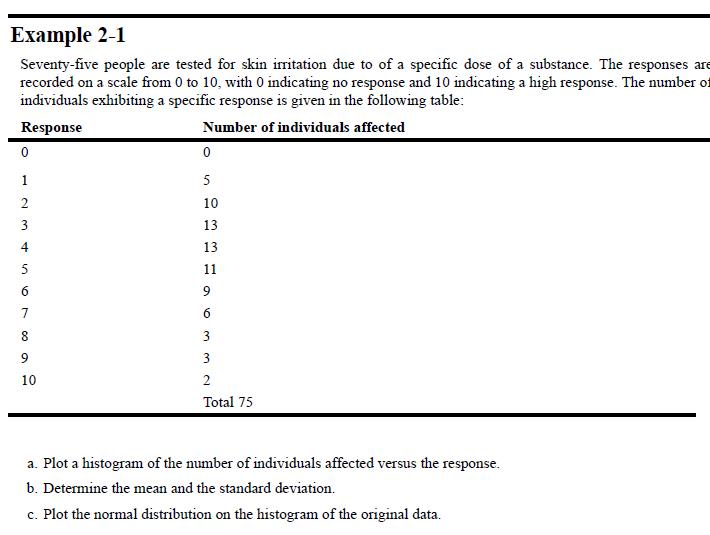
Example 2-1 Seventy-five people are tested for skin irritation due to of a specific dose of a substance. The responses are recorded on a scale from 0 to 10, with 0 indicating no response and 10 indicating a high response. The number of individuals exhibiting a specific response is given in the following table: Response Number of individuals affected 0 123 45 679 8 9 10 0 5 10 13 13 11 9 6 3 3 2 Total 75 a. Plot a histogram of the number of individuals affected versus the response. b. Determine the mean and the standard deviation. c. Plot the normal distribution on the histogram of the original data.
Step by Step Solution
3.31 Rating (160 Votes )
There are 3 Steps involved in it

Get step-by-step solutions from verified subject matter experts