

Question: Using the data in the table below, what is the equilibrium quantity and equllibrium price for a cellular telephone? Draw a graph to show
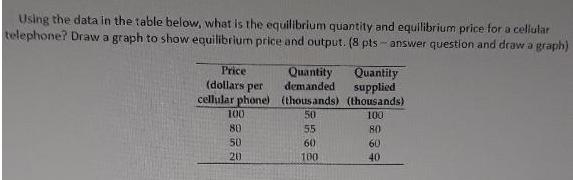
Using the data in the table below, what is the equilibrium quantity and equllibrium price for a cellular telephone? Draw a graph to show equilibrium price and output. (8 pts - answer question and draw a graph) Price (dollars per cellular phone) (thousands) (thousands) Quantity Quantity supplied demanded 100 50 100 80 55 80 50 60 60 20 100 40
Step by Step Solution
★★★★★
3.38 Rating (154 Votes )
There are 3 Steps involved in it
1 Expert Approved Answer
Step: 1 Unlock

Question Has Been Solved by an Expert!
Get step-by-step solutions from verified subject matter experts
Step: 2 Unlock
Step: 3 Unlock