

Question: Using the data in the table II What was the average annual retum of Microsoft stock from 2005-2017? b. What was the annual volatility for
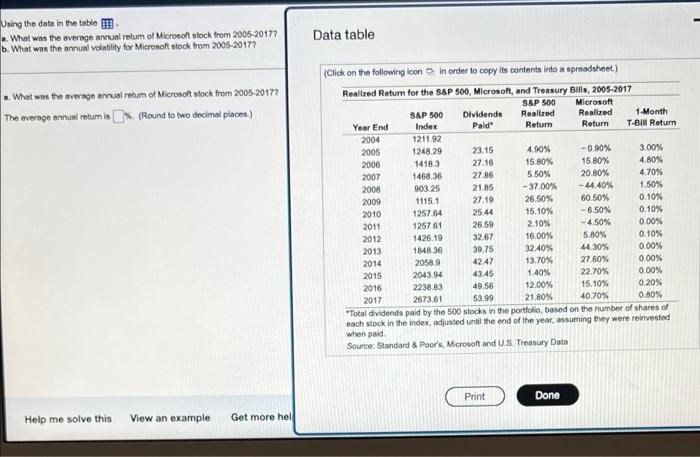
Using the data in the table II What was the average annual retum of Microsoft stock from 2005-2017? b. What was the annual volatility for Microsoft stock trom 2005-2017? Data table What was the average annual retum of Microsoft stock from 2005-2017? The average annual retum is % (Round to two decimal places) (Click on the following icon in order to copy its contents into a spreadsheet.) Realled Return for the S&P 500, Microsoft, and Treasury Bills, 2005-2017 S&P 500 Microsoft S&P 500 Dividends Realized Realized 1-Month Year End Index Pald Return Return T-BIH Return 2004 1211.92 2005 1248.29 23.15 4.90% -0.90% 3.00% 2006 14163 27.16 15.80% 15.80% 4.80% 2007 1468.36 27 86 5.50% 20.80% 4.70% 2008 90325 21.85 - 37.00% - 44.40% 1.50% 2009 1115.1 27.19 26.50% 60.50% 0.10% 2010 1257.64 25.44 15.10% -6.50% 0.10% 2011 1257 61 26.59 2.10% -4.50% 0.00% 2012 1426.19 3267 16.00% 5.80% 0.10% 2013 1848.36 39.75 32.40% 44,30% 0.00% 2014 20589 4247 13.70% 27 60% 0.00% 2015 2043.94 4345 1.40% 22.70% 0.00% 2016 2238.83 49.56 12.00% 15.10% 0.20% 2017 2673.61 53.99 21.80% 40.70% 0.80% "Total dividends paid by the 500 stocks in the portfolio, based on the number of shares of each lock in the index, adjusted until the end of the year, assuming they were reinvested when poid Source: Standard & Poor's, Microsoft and US Treasury Data Print Done Help me solve this View an example Get more hel
Step by Step Solution
There are 3 Steps involved in it

Get step-by-step solutions from verified subject matter experts