

Question: Using the data set you collected in Week 1, excluding the supercar outlier, you should have calculated the mean and standard deviation during Week 2
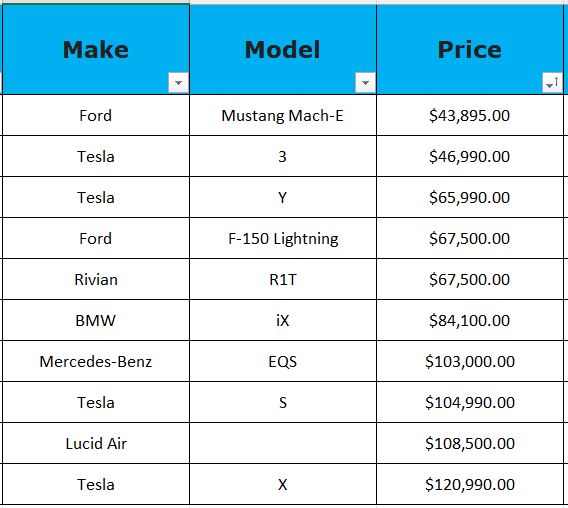
Using the data set you collected in Week 1, excluding the supercar outlier, you should have calculated the mean and standard deviation during Week 2 for price data. Along with finding a p and q from Week 3. Using this information, calculate two 95% confidence intervals. For the first interval, you need to calculate a T-confidence interval for the sample population. You have the mean, standard deviation, and sample size, all you have left to find is the T-critical value and you can calculate the interval. For the second interval calculate a proportion confidence interval using the proportion of the number of cars that fall below the average. You have the p, q, and n, all that is left is calculating a Z-critical value.
Make sure you include these values in your post, so your fellow classmates can use them to calculate their own confidence intervals. Once you calculate the confidence intervals you will need to interpret your interval and explain what this means in words.
Do the confidence intervals surprise you, knowing what you have learned about confidence intervals, proportions and normal distribution?
How useful can this type of information be when you go to buy a new car or even a house?
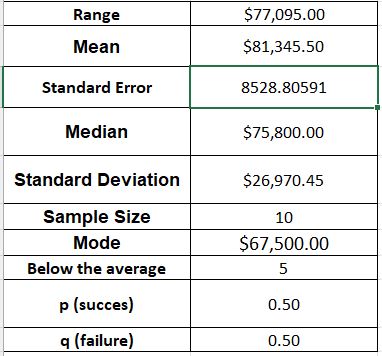
\fRange Mean Standard Error Median Standard Deviation Sample Size Mode Below the average p {succes} :1 (failure) $77,095.00 $81,345.50 8528.80591 $75,800.00 $26,970.45 10 $673,500.00 5 0.50 0.50
Step by Step Solution
There are 3 Steps involved in it

Get step-by-step solutions from verified subject matter experts