

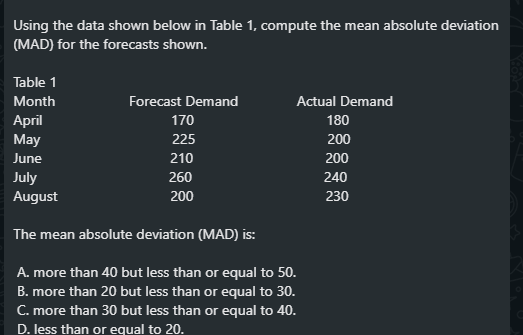
Question: Using the data shown below in Table 1, compute the mean absolute deviation (MAD) for the forecasts shown. Table 1 Month April May June July
Step by Step Solution
There are 3 Steps involved in it
1 Expert Approved Answer
Step: 1 Unlock

Question Has Been Solved by an Expert!
Get step-by-step solutions from verified subject matter experts
Step: 2 Unlock
Step: 3 Unlock