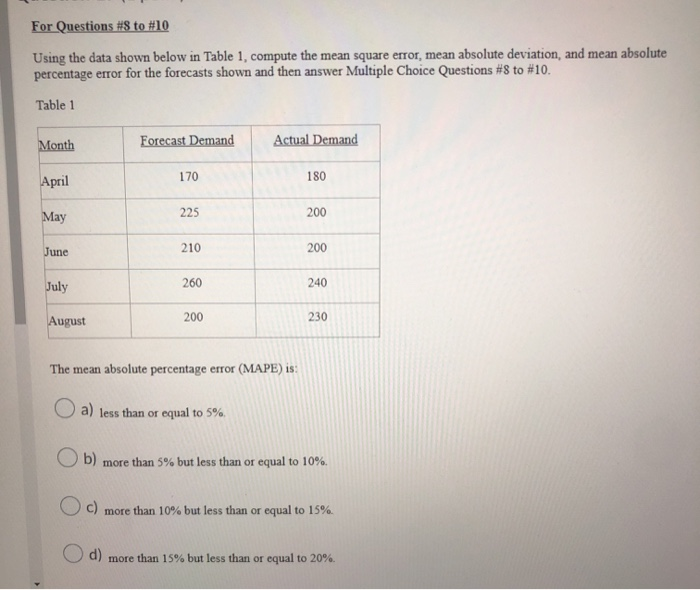
Question: For Questions #8 to #10 Using the data shown below in Table 1, compute the mean square error, mean absolute deviation, and mean absolute percentage

For Questions #8 to #10 Using the data shown
For Questions #8 to #10 Using the data shown below in Table 1, compute the mean square error, mean absolute deviation, and mean absolute percentage error for the forecasts shown and then answer Multiple Choice Questions #8 to #10. Table 1 Month Forecast Demand Actual Demand April 170 180 May 225 200 June 210 200 July 260 240 August 200 The mean absolute percentage error (MAPE) is a) less than or equal to 5%. b) more than 5% but less than or equal to 10%. c) more than 10% but less than or equal to 15% d) more than 15% but less than or equal to 20%

Step by Step Solution

There are 3 Steps involved in it

1 Expert Approved Answer
Step: 1 Unlock blur-text-image
Question Has Been Solved by an Expert!

Get step-by-step solutions from verified subject matter experts

Step: 2 Unlock
Step: 3 Unlock

Students Have Also Explored These Related General Management Questions!