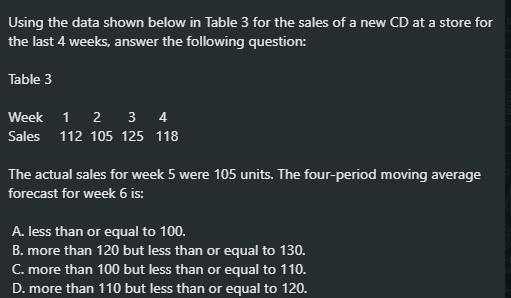
Question: Using the data shown below in Table 3 for the sales of a new CD at a store for the last 4 weeks, answer the

Using the data shown below in Table 3 for the

Using the data shown below in Table 3 for the sales of a new CD at a store for the last 4 weeks, answer the following question: Table 3 Week 1 2 3 4 Sales 112 105 125 118 The actual sales for week 5 were 105 units. The four-period moving average forecast for week 6 is: A. less than or equal to 100. B. more than 120 but less than or equal to 130. C. more than 100 but less than or equal to 110. D. more than 110 but less than or equal to 120

Step by Step Solution

There are 3 Steps involved in it

1 Expert Approved Answer
Step: 1 Unlock blur-text-image
Question Has Been Solved by an Expert!

Get step-by-step solutions from verified subject matter experts

Step: 2 Unlock
Step: 3 Unlock

Students Have Also Explored These Related General Management Questions!