

Question: Using the data shown in Table Q2, set up a control chart to improve the fraction of nonconforming cans produced by this machine. QUESTION 2
Using the data shown in Table Q2, set up a control chart to improve the fraction of nonconforming cans produced by this machine.
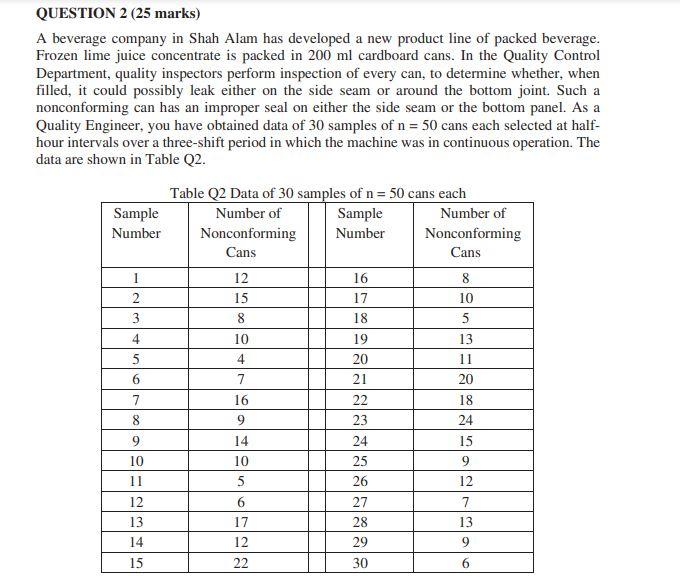
QUESTION 2 (25 marks) A beverage company in Shah Alam has developed a new product line of packed beverage. Frozen lime juice concentrate is packed in 200 ml cardboard cans. In the Quality Control Department, quality inspectors perform inspection of every can, to determine whether, when filled, it could possibly leak either on the side seam or around the bottom joint. Such a nonconforming can has an improper seal on either the side seam or the bottom panel. As a Quality Engineer, you have obtained data of 30 samples of n = 50 cans each selected at half- hour intervals over a three-shift period in which the machine was in continuous operation. The data are shown in Table Q2. Table Q2 Data of 30 samples of n = 50 cans each Sample Number of Sample Number of Number Nonconforming Number Nonconforming Cans Cans 12 15 8 1 2 3 4 5 6 10 4 7 16 9 8 10 5 13 11 20 18 24 15 7 16 17 18 19 20 21 22 23 24 25 26 27 28 29 30 8 9 10 14 10 9 12 11 5 6 12 13 14 17 7 13 9 12 15 22 6Step by Step Solution
There are 3 Steps involved in it
1 Expert Approved Answer
Step: 1 Unlock

Question Has Been Solved by an Expert!
Get step-by-step solutions from verified subject matter experts
Step: 2 Unlock
Step: 3 Unlock