

Question: Using the data shown in the table here, , that contains historical monthly prices and dividends (paid at the end of the month) for Ford
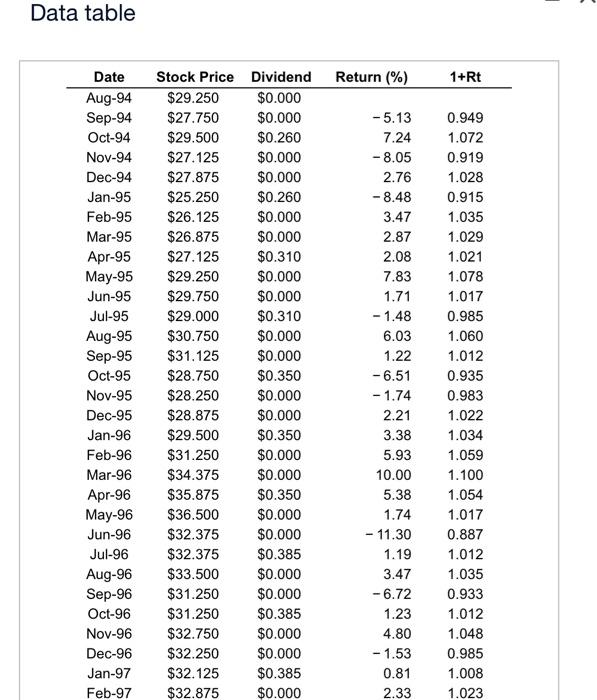
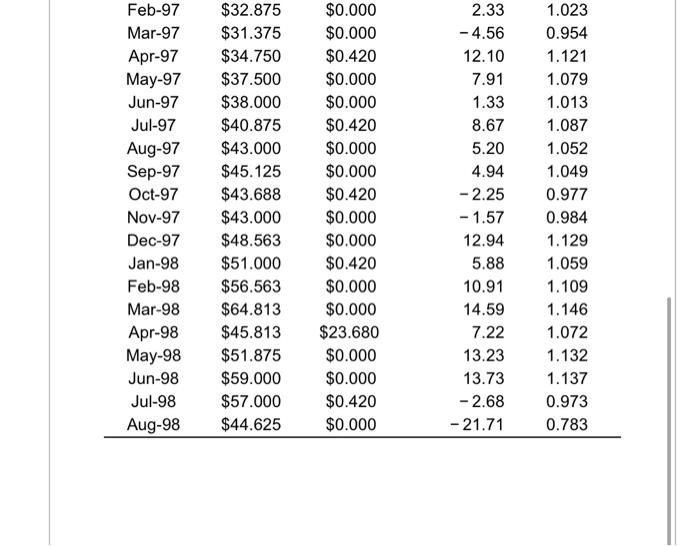
Using the data shown in the table here, , that contains historical monthly prices and dividends (paid at the end of the month) for Ford Motor Company stock (Ticker. F) from August 1994 to August 1998, compute the: a. Average monthly retum over this period. b. Monthly volatlity (or standard deviation) over this period. c. 95% confidence interval of the estimate of the average monthly return. Data table \begin{tabular}{crrrr} Feb-97 & $32.875 & $0.000 & 2.33 & 1.023 \\ Mar-97 & $31.375 & $0.000 & -4.56 & 0.954 \\ Apr-97 & $34.750 & $0.420 & 12.10 & 1.121 \\ May-97 & $37.500 & $0.000 & 7.91 & 1.079 \\ Jun-97 & $38.000 & $0.000 & 1.33 & 1.013 \\ Jul-97 & $40.875 & $0.420 & 8.67 & 1.087 \\ Aug-97 & $43.000 & $0.000 & 5.20 & 1.052 \\ Sep-97 & $45.125 & $0.000 & 4.94 & 1.049 \\ Oct-97 & $43.688 & $0.420 & -2.25 & 0.977 \\ Nov-97 & $43.000 & $0.000 & -1.57 & 0.984 \\ Dec-97 & $48.563 & $0.000 & 12.94 & 1.129 \\ Jan-98 & $51.000 & $0.420 & 5.88 & 1.059 \\ Feb-98 & $56.563 & $0.000 & 10.91 & 1.109 \\ Mar-98 & $64.813 & $0.000 & 14.59 & 1.146 \\ Apr-98 & $45.813 & $23.680 & 7.22 & 1.072 \\ May-98 & $51.875 & $0.000 & 13.23 & 1.132 \\ Jun-98 & $59.000 & $0.000 & 13.73 & 1.137 \\ Jul-98 & $57.000 & $0.420 & -2.68 & 0.973 \\ Aug-98 & $44.625 & $0.000 & -21.71 & 0.783 \\ \hline \end{tabular}
Step by Step Solution
There are 3 Steps involved in it

Get step-by-step solutions from verified subject matter experts