

Question: Using the density figures below, what is an approximate range of common/typical values (say the most common 90%) for the distribution in the panel labeled
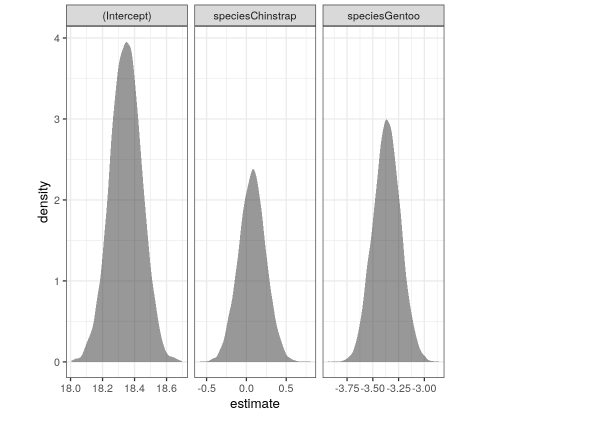
Using the density figures below, what is an approximate range of common/typical values (say the most common 90%) for the distribution in the panel labeled "speciesGentoo"?
Options:
-3.6 mm to -3.1 mm
-3.9 mm to -2.9 mm
-3.4 mm to -3.3 mm

Step by Step Solution
There are 3 Steps involved in it
1 Expert Approved Answer
Step: 1 Unlock

Question Has Been Solved by an Expert!
Get step-by-step solutions from verified subject matter experts
Step: 2 Unlock
Step: 3 Unlock