

Question: Using the Excel Data Set attached, create an X bar and R chart. Explain and analyze the chart regarding any out of control condition and
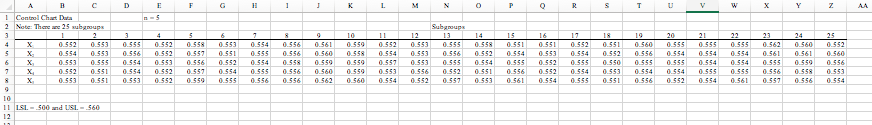
Using the Excel Data Set attached, create an X bar and R chart. Explain and analyze the chart regarding any out of control condition and by what they could possibly be caused. Compute the Cp and Cpk and explain what these statistics mean to the analysis. What percentage of product is out of control (use the z distribution). Submit the completed assignment here in doc or docx format prior to the due date stated in the schedule. Remember, I do not accept any hand written documents or images of handwritten documents.
\f
Step by Step Solution
There are 3 Steps involved in it
1 Expert Approved Answer
Step: 1 Unlock

Question Has Been Solved by an Expert!
Get step-by-step solutions from verified subject matter experts
Step: 2 Unlock
Step: 3 Unlock