

Question: Using the Excel inventory template found on the companion website if you choose, and starting with an Excel spreadsheet including data for this problem, which
Using the Excel inventory template found on the companion website if you choose, and starting with an Excel spreadsheet including data for this problem, which also is available on the companion website, prepare the following exercise.
Hospital purchasing agent Abby Smith needs to order examination gloves. Currently, she orders 1,000 boxes of gloves whenever she thinks a need for the item exists. Abby has heard that a better way is available to do her job and wants to use EOQ to determine how much to order and when. She collects the following information.
| Cost of gloves: | $4.00/box |
| Carrying costs: | 33%, or $_____ /box |
| Cost of ordering: | $150/order |
| Lead time: | 10 days |
| Annual demand: | 10,000 boxes/year |
A. What quantity should Abby order? Prove that your order quantity is better than Abbys by graphing ordering costs, holding costs, and total costs for 1,000, 1,500, and 2,000 boxes.
B. How often should Abby place the order? Approximately how much time (in days) will elapse between orders?
C. Assuming that Abby is not worried about SS, when should she place her order? Draw another graph to illustrate why she needs to place her order at that particular point.
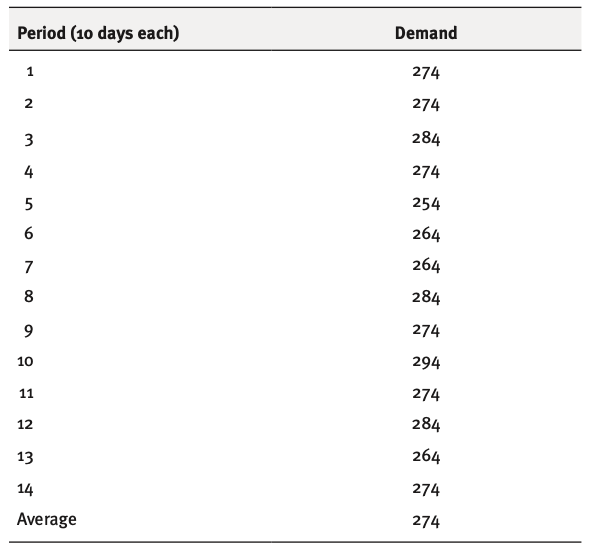
D. Abby is concerned that the reorder point she determined is wrong because demand for gloves varies. She gathers the following usage information:
E. Abby decides she will be happy if the probability of a stockout is 5 percent. How much SS should Abby carry?
F. If Abby were to set up a two-bin system for gloves, how many boxes of gloves would be in each bin?
If possible can you please explain how you got the answers and please show with excel. Thank you in advance!
\begin{tabular}{cc} Period (10 days each) & Demand \\ \hline 1 & 274 \\ 2 & 274 \\ 3 & 284 \\ 4 & 274 \\ 5 & 254 \\ 6 & 264 \\ 7 & 264 \\ 8 & 284 \\ 9 & 274 \\ 10 & 294 \\ 11 & 274 \\ 12 & 284 \\ 13 & 264 \\ 14 & 274 \\ Average & 274 \end{tabular} \begin{tabular}{cc} Period (10 days each) & Demand \\ \hline 1 & 274 \\ 2 & 274 \\ 3 & 284 \\ 4 & 274 \\ 5 & 254 \\ 6 & 264 \\ 7 & 264 \\ 8 & 284 \\ 9 & 274 \\ 10 & 294 \\ 11 & 274 \\ 12 & 284 \\ 13 & 264 \\ 14 & 274 \\ Average & 274 \end{tabular}
Step by Step Solution
There are 3 Steps involved in it

Get step-by-step solutions from verified subject matter experts