

Question: Using the experimental data for P analysis using autoanalyzer make a standard addition curve like above example curve for your data 2. Corrected Values, Channel::
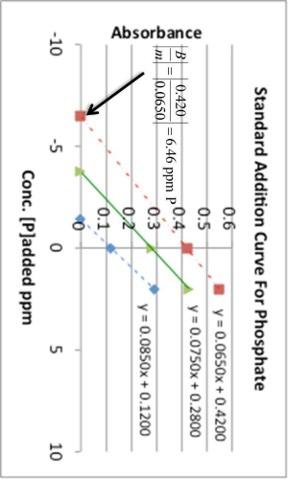
Using the experimental data for P analysis using autoanalyzer make a standard addition curve like above example curve for your data
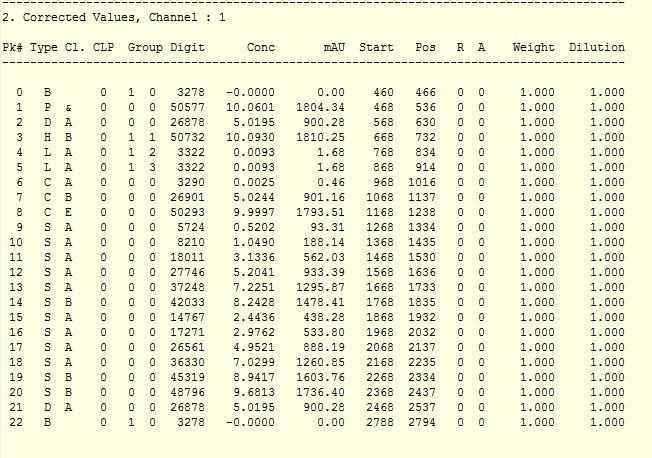
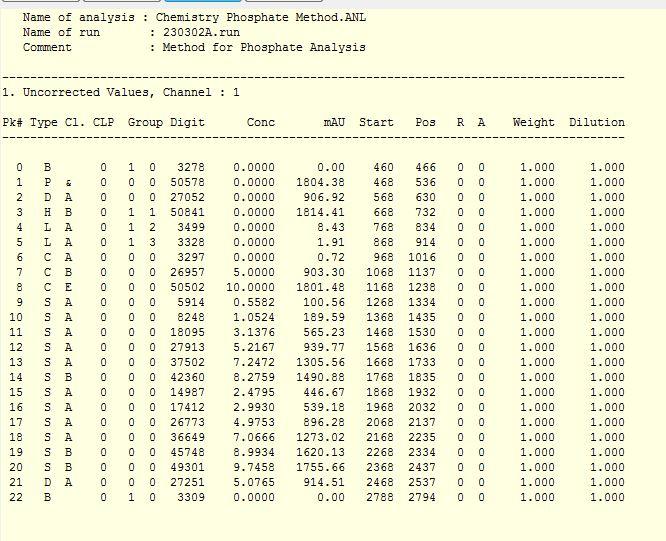
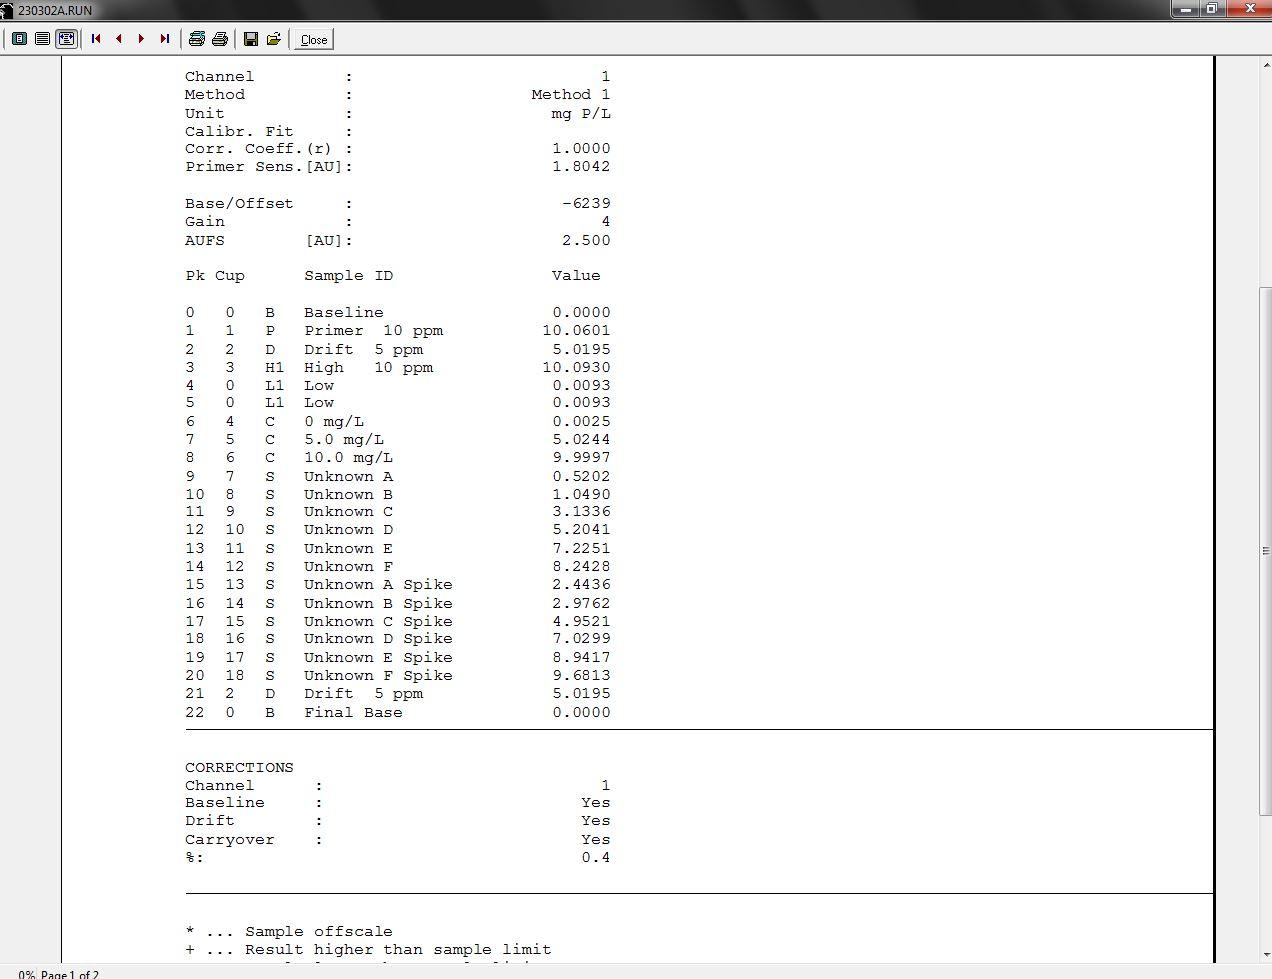
2. Corrected Values, Channel:: 1 Pk\# Type Cl. CLP Group Digit Conc mAU Start Pos R A Weight Dilution Name of analysis : Chemistry Phosphate Method. ANL * .. Sample offscale + ... Result higher than sample limit Standard Addition Curve For Phosphate 2. Corrected Values, Channel:: 1 Pk\# Type Cl. CLP Group Digit Conc mAU Start Pos R A Weight Dilution Name of analysis : Chemistry Phosphate Method. ANL * .. Sample offscale + ... Result higher than sample limit Standard Addition Curve For Phosphate
Step by Step Solution
There are 3 Steps involved in it
1 Expert Approved Answer
Step: 1 Unlock

Question Has Been Solved by an Expert!
Get step-by-step solutions from verified subject matter experts
Step: 2 Unlock
Step: 3 Unlock