

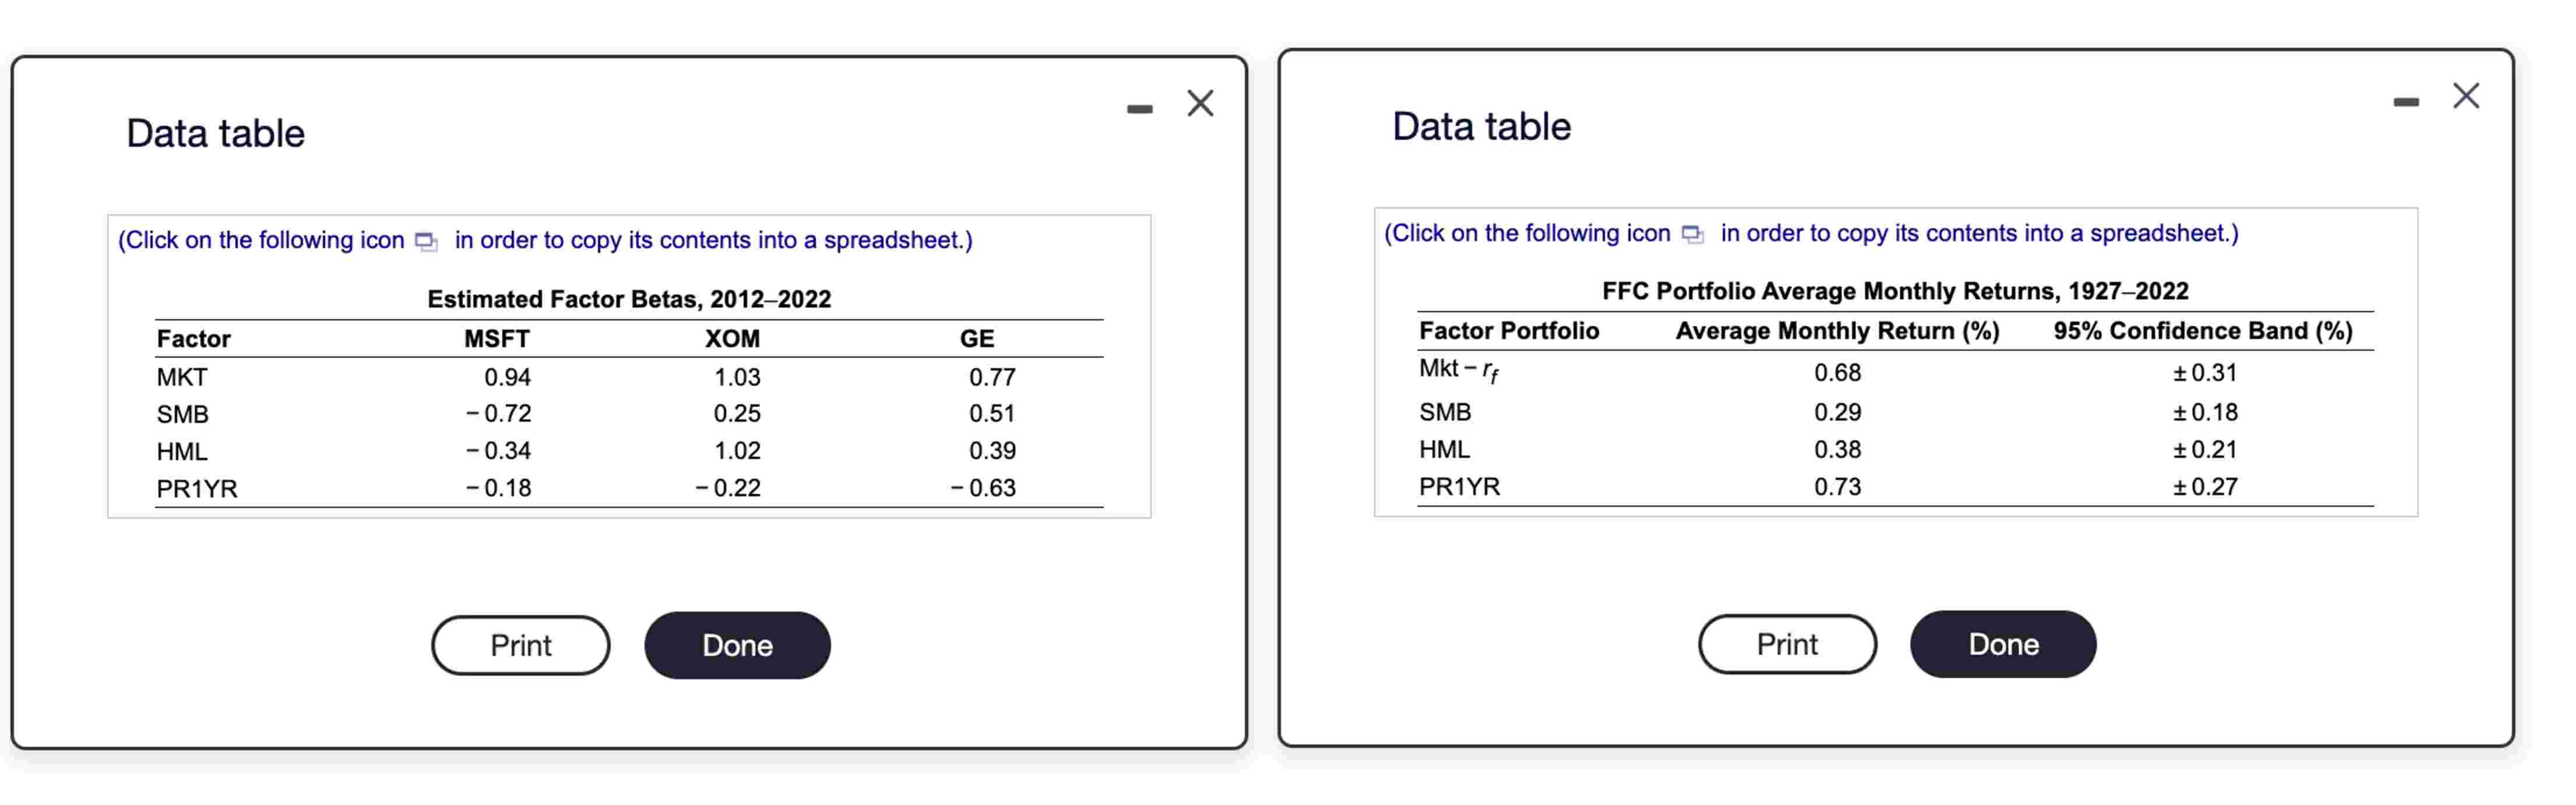
Question: Using the factor beta estimates in the table shown here ( left chart ) and the monthly expected return estimates in Table 1 3 .
Using the factor beta estimates in the table shown here left chart and the monthly expected return estimates in Tableright chart calculate the risk premium of General ElectricGeneralElectric
stockticker:GE using the FFC factor specification.Annualize your result by multiplying by GEs CAPM beta over the same time period was How does the risk premium you would estimate from the CAPM compare?
Question #: Using the FFC factor specification, the monthly risk premium of General ElectricGeneralElectric stock is round decimal places
Question #: Using the FFC factor specification, the annual risk premium of General Electric stock is round decimal places
Question #: The annual risk premium of General Electric stock produced by the CAPM beta is Round to two decimal places.
Question #: The annual risk premium produced by the CAPM beta is higher or lower than the annual risk premium of General Electric stock using the FFC factor specification. Data table
Click on the following icon in order to copy its contents into a spreadsheet.
Data table
Click on the following icon in order to copy its contents into a spreadsheet.
FFC Portfolio Average Monthly Returns,
Step by Step Solution
There are 3 Steps involved in it
1 Expert Approved Answer
Step: 1 Unlock

Question Has Been Solved by an Expert!
Get step-by-step solutions from verified subject matter experts
Step: 2 Unlock
Step: 3 Unlock