

Question: Using the factory energy cost data in the table below, find the best moving average and exponential smoothing models. begin{tabular}{cc} Year & Energy Costs
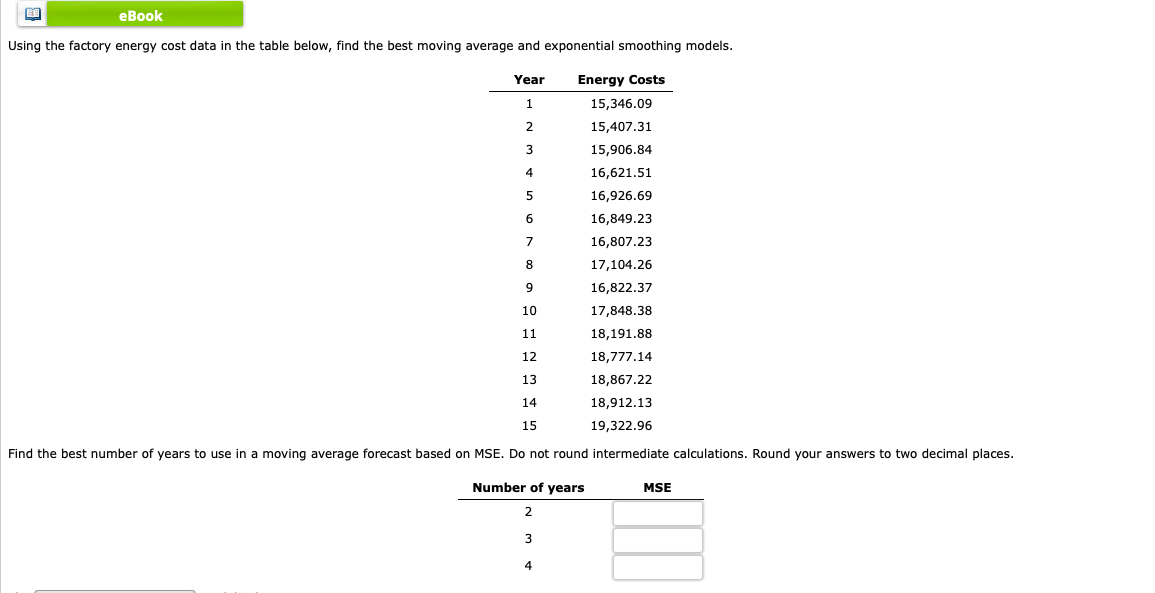
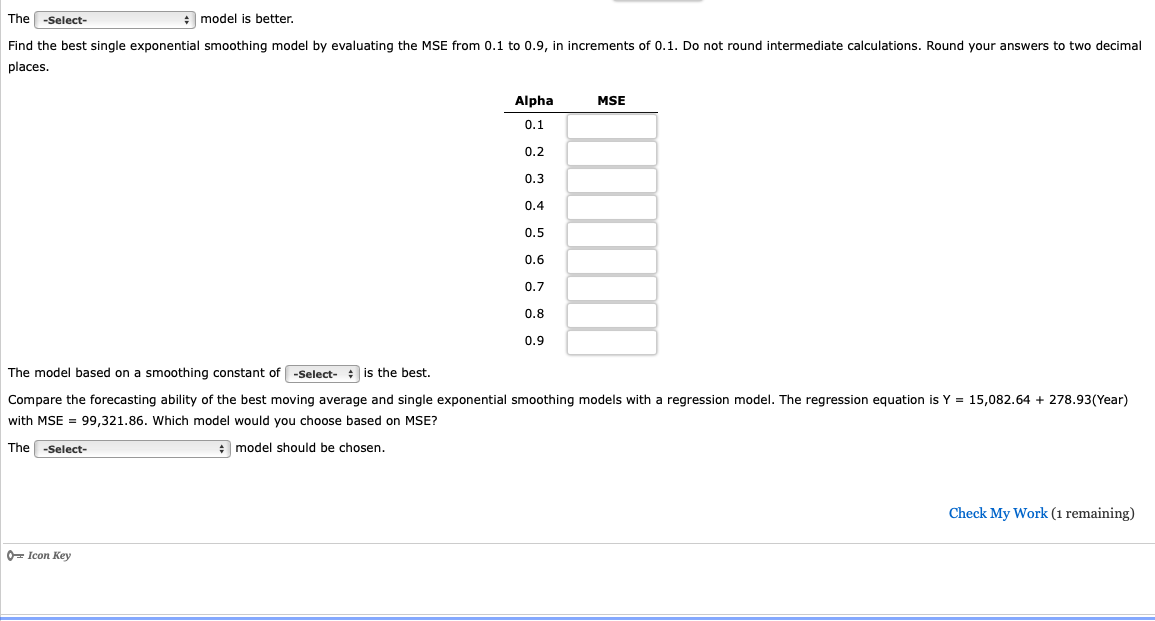
Using the factory energy cost data in the table below, find the best moving average and exponential smoothing models. \begin{tabular}{cc} Year & Energy Costs \\ \hline 1 & 15,346.09 \\ 2 & 15,407.31 \\ 3 & 15,906.84 \\ 4 & 16,621.51 \\ 5 & 16,926.69 \\ 6 & 16,849.23 \\ 7 & 16,807.23 \\ 8 & 17,104.26 \\ 9 & 16,822.37 \\ 10 & 17,848.38 \\ 11 & 18,191.88 \\ 12 & 18,777.14 \\ 13 & 18,867.22 \\ 14 & 18,912.13 \\ 15 & 19,322.96 \end{tabular} Find the best number of years to use in a moving average forecast based on MSE. Do not round intermediate calculations. Round your answers to two decimal places. \begin{tabular}{c:c} Number of years & MSE \\ \hline 2 & \\ 3 & \\ 4 & \\ \hline \end{tabular} The model is better. Find the best single exponential smoothing model by evaluating the MSE from 0.1 to 0.9, in increments of 0.1. Do not round intermediate calculations. Round your answers to two decimal places. The model based on a smoothing constant of is the best. Compare the forecasting ability of the best moving average and single exponential smoothing models with a regression model. The regression equation is Y=15,082.64+278.93(Year) with MSE =99,321.86. Which model would you choose based on MSE? The model should be chosen
Step by Step Solution
There are 3 Steps involved in it

Get step-by-step solutions from verified subject matter experts