

Question: Using the financial statements find these following ratios 1 INSERT DISNEY INCOME STATEMENT AS ORIGINALLY REPORTED BELOW 2 THE WALT DISNEY CO (DIS) CashFlowFlag INCOME
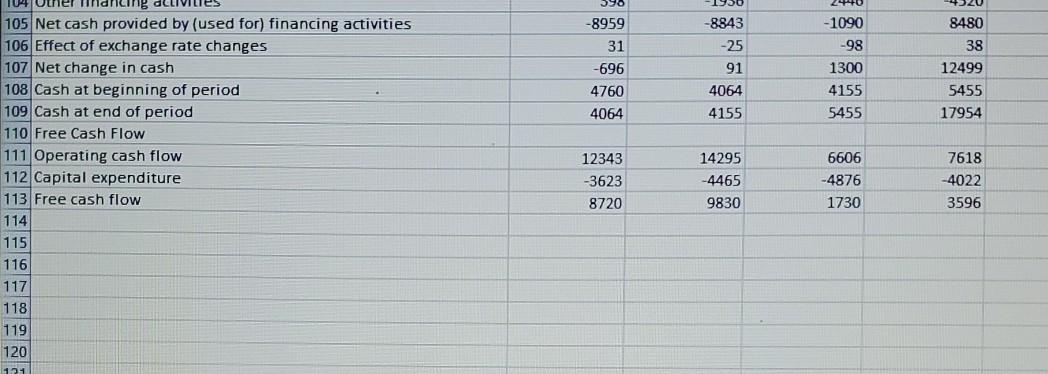
Using the financial statements find these following ratios
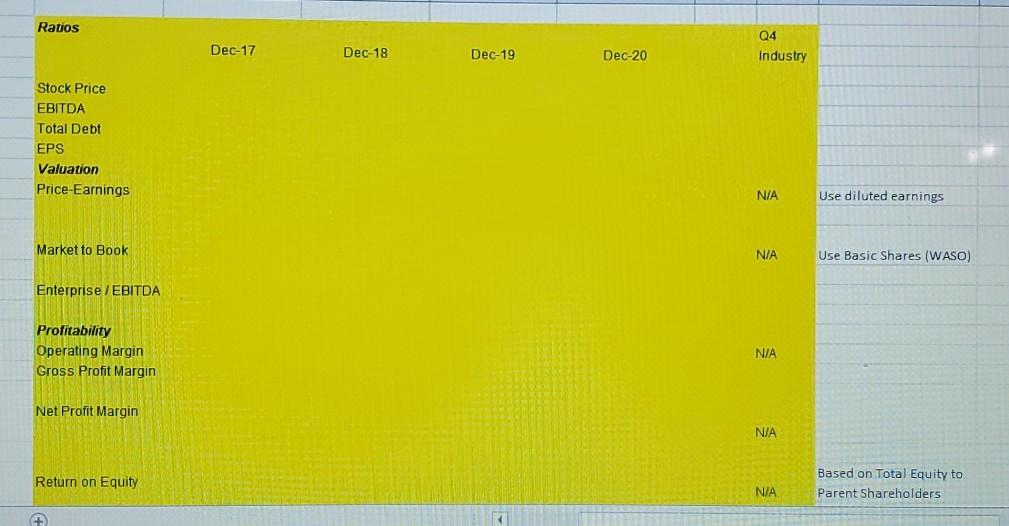
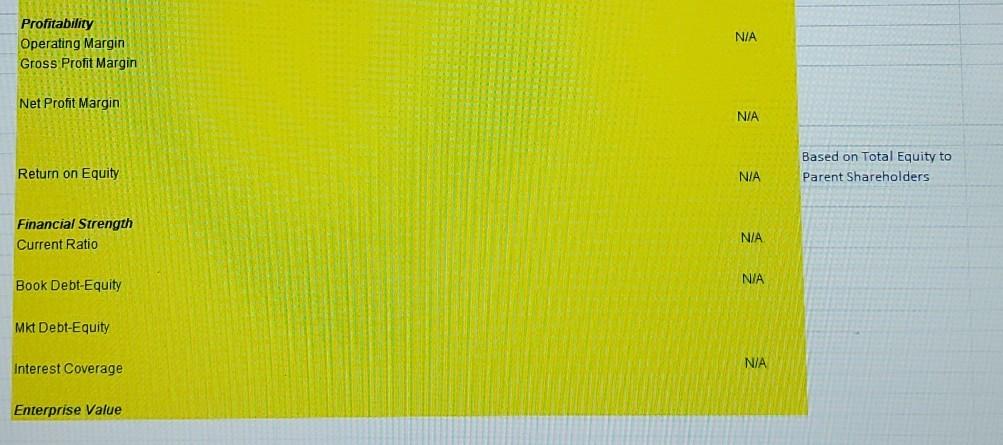
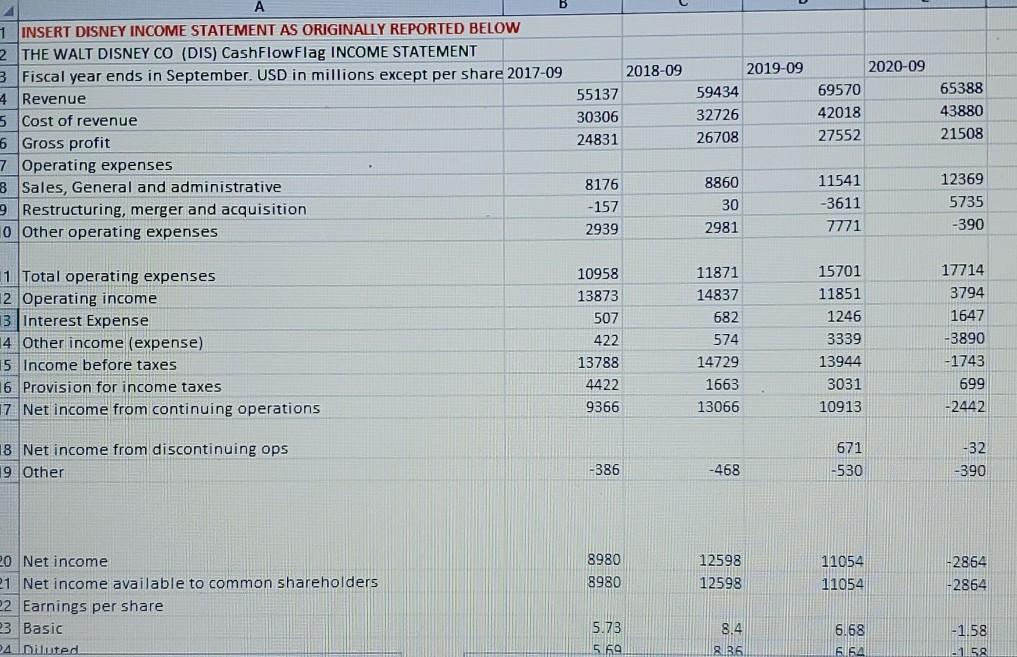
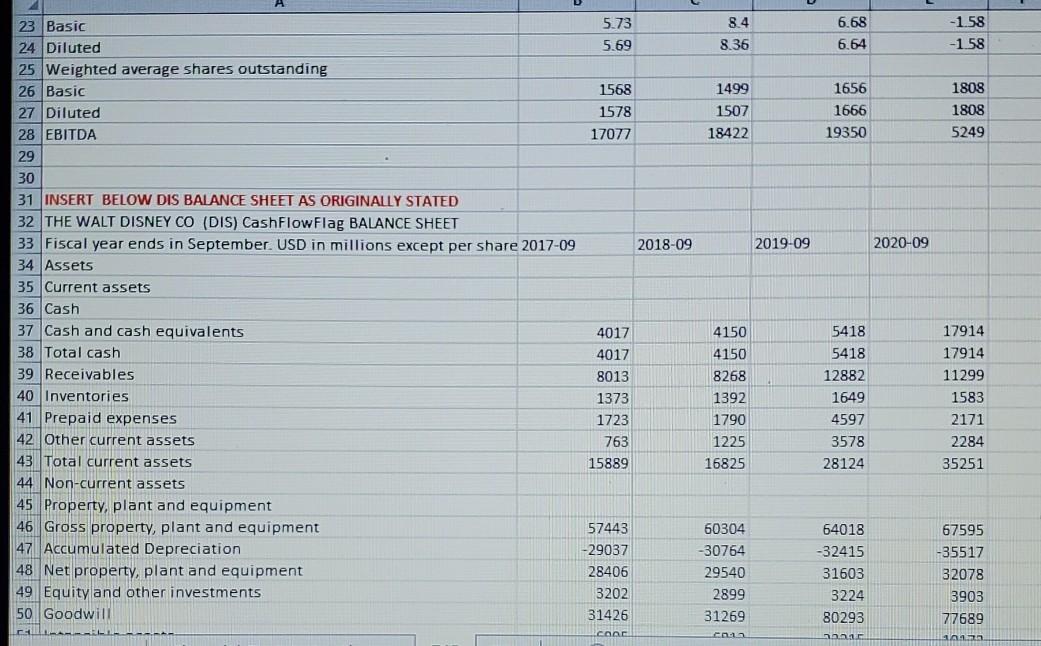
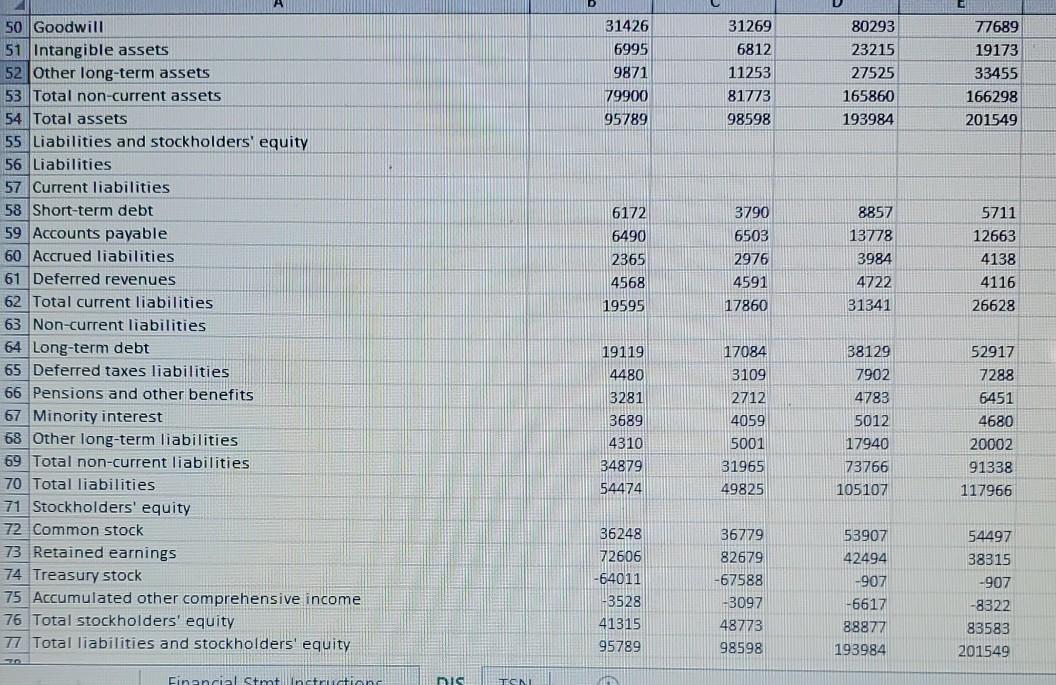
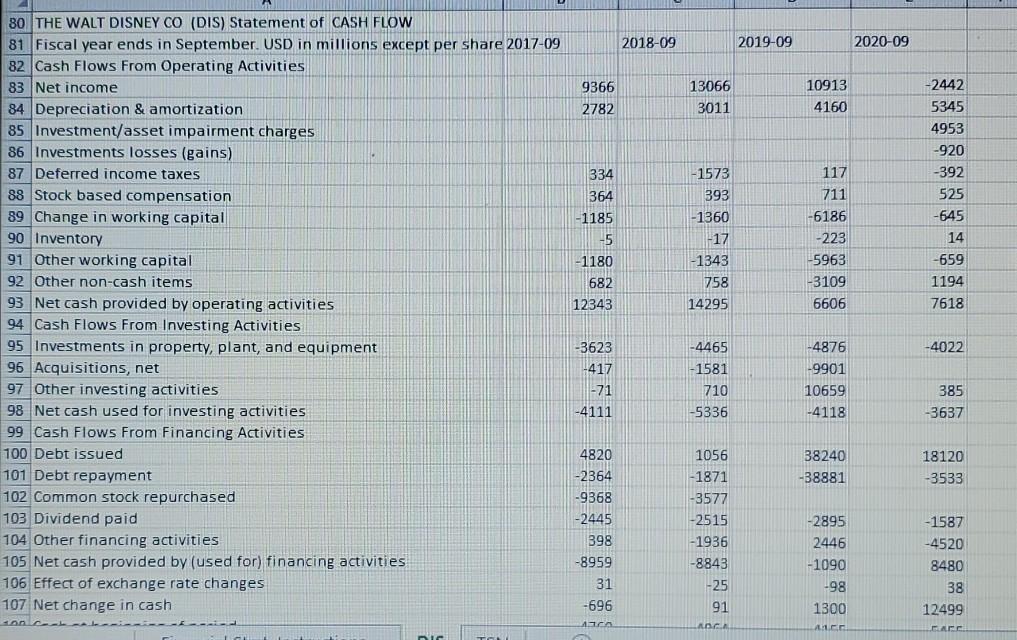
1 INSERT DISNEY INCOME STATEMENT AS ORIGINALLY REPORTED BELOW 2 THE WALT DISNEY CO (DIS) CashFlowFlag INCOME STATEMENT 3 Fiscal year ends in September. USD in millions except per share 2017-09 4 Revenue 5 Cost of revenue 6 Gross profit 7 Operating expenses 8 Sales, General and administrative 9 Restructuring, merger and acquisition 0 Other operating expenses 2018-09 55137 30306 24831 2019-09 59434 32726 26708 2020-09 69570 42018 27552 65388 43880 21508 8860 8176 -157 2939 11541 -3611 7771 12369 5735 30 2981 -390 11 Total operating expenses 2 Operating income B. Interest Expense 4 Other income (expense) 5 Income before taxes 16 Provision for income taxes 17 Net income from continuing operations 10958 13873 507 422 13788 4422 9366 11871 14837 682 574 14729 1663 13066 15701 11851 1246 3339 13944 3031 10913 17714 3794 1647 -3890 -1743 699 -2442 18 Net income from discontinuing ops 19 Other 671 -530 -32 -390 -386 -468 11054 8980 8980 12598 12598 -2864 -2864 11054 20 Net income 21 Net income available to common shareholders P2 Earnings per share 23 Basic 24.Diluted 5.73 5.69 8.4 8.35 6.68 S15A -1.58 158 23 Basic 5.73 8.4 6.68 -158 24 Diluted 5.69 8.36 6.64 -158 25 Weighted average shares outstanding 26 Basic 1568 1499 1656 1808 27 Diluted 1578 1507 1666 1808 28 EBITDA 17077 18422 19350 5249 29 30 31 INSERT BELOW DIS BALANCE SHEET AS ORIGINALLY STATED 32 THE WALT DISNEY CO (DIS) Cash Flow Flag BALANCE SHEET 33 Fiscal year ends in September. USD in millions except per share 2017-09 2018-09 2019-09 2020-09 34 Assets 35 Current assets 36 Cash 37 Cash and cash equivalents 4017 4150 5418 17914 38 Total cash 4017 4150 5418 17914 39 Receivables 8013 8268 12882 11299 40 Inventories 1373 1392 1649 1583 41 Prepaid expenses 1723 1790 4597 2171 42 Other current assets 763 1225 3578 2284 43 Total current assets 15889 16825 28124 35251 44 Non-current assets 45 Property, plant and equipment 46. Gross property, plant and equipment 57443 60304 64018 67595 47 Accumulated Depreciation -29037 -30764 -32415 -35517 48 Net property, plant and equipment 28406 29540 31603 32078 49 Equity and other investments 3202 2899 3224 3903 50 Goodwill 31426 31269 80293 77689 CONCI 1012 CA 80293 31426 6995 9871 79900 95789 31269 6812 11253 81773 98598 23215 27525 165860 193984 77689 19173 33455 166298 201549 6172 6490 2365 4568 19595 3790 6503 2976 4591 17860 8857 13778 3984 4722 31341 5711 12663 4138 4116 26628 50 Goodwill 51 Intangible assets 52 Other long-term assets 53 Total non-current assets 54 Total assets 55 Liabilities and stockholders' equity 56 Liabilities 57 Current liabilities 58 Short-term debt 59 Accounts payable 60 Accrued liabilities 61 Deferred revenues 62 Total current liabilities 63 Non-current liabilities 64 Long-term debt 65 Deferred taxes liabilities 66 Pensions and other benefits 67 Minority interest 68 Other long-term liabilities 69 Total non-current 70 Total liabilities 71 Stockholders' equity 72 Common stock 73 Retained earnings 74 Treasury stock 75 Accumulated other comprehensive income 76 Total stockholders' equity 17 Total liabilities and stockholders' equity 19119 4480 3281 3689 17084 3109 2712 4059 38129 7902 4783 5012 17940 73766 105107 52917 7288 6451 4680 20002 91338 117966 4310 34879 54474 5001 31965 49825 36779 53907 42494 -907 36248 72606 -64011 -3528 41315 95789 82679 -67588 -3097 48773 98598 54497 38315 -907 -8322 83583 201549 -6617 88877 193984 so Financial stmtillin nis TONI 2018-09 2019-09 2020-09 9366 2782 13066 3011 10913 4160 334 364 -1185 -5 -1180 682 12343 - 1573 393 -1360 -17 - 1343 758 14295 117 711 -6186 -223 -5963 -3109 6606 -2442 5345 4953 -920 -392 525 -645 14 -659 1194 7618 30 THE WALT DISNEY CO (DIS) Statement of CASH FLOW 81 Fiscal year ends in September. USD in millions except per share 2017-09 82 Cash Flows From Operating Activities 83 Net income 84 Depreciation & amortization 85 Investment/asset impairment charges 86 Investments losses (gains) 87 Deferred income taxes 88 Stock based compensation 89 Change in working capital 90 Inventory 91 Other working capital 92 Other non-cash items 93 Net cash provided by operating activities 94 Cash Flows From Investing Activities 95 Investments in property, plant, and equipment 96 Acquisitions, net 97 Other investing activities 98 Net cash used for investing activities 99 Cash Flows From Financing Activities 100 Debt issued 101 Debt repayment 102 Common stock repurchased 103 Dividend paid 104 Other financing activities 105 Net cash provided by (used for) financing activities 106 Effect of exchange rate changes 107 Net change in cash -4022 -3623 -417 1-71 -4111 -4465 -1581 710 -5336 -4876 -9901 10659 -4118 385 -3637 38240 -38881 18120 -3533 4820 -2364 -9368 -2445 398 1056 -1871 -3577 -2515 -1936 -8843 -25 91 AOC -8959 31 -696 ACA -2895 2446 -1090 -98 1300 - 1587 -4520 8480 38 12499 ALLE 390 -8959 8480 31 -696 4760 4064 -8843 -25 91 4064 -1090 -98 1300 4155 5455 38 12499 5455 17954 4155 104 Other inancing 105 Net cash provided by (used for) financing activities 106 Effect of exchange rate changes 107 Net change in cash 108 Cash at beginning of period 109 Cash at end of period 110 Free Cash Flow 111 Operating cash flow 112 Capital expenditure 113 Free cash flow 114 115 116 117 118 14295 12343 -3623 8720 -4465 9830 6606 -4876 1730 7618 -4022 3596 119 120 121 Ratios 04 Dec-17 Dec-18 Dec-19 Dec-20 Industry Stock Price EBITDA Total Debt EPS Valuation Price-Earnings N/A Use diluted earnings Market to Book N/A Use Basic Shares (WASO) Enterprise/EBITDA Profitability Operating Margin Gross Profit Margin N/A Net Profit Margin N/A Return on Equity N/A Based on Total Equity to Parent Shareholders N/A Profitability Operating Margin Gross Profit Margin Net Profit Margin N/A Return on Equity Based on Total Equity to Parent Shareholders N/A Financial Strength Current Ratio N/A N/A Book Debt-Equity Mkt Debt-Equity Interest Coverage N/A Enterprise Value 1 INSERT DISNEY INCOME STATEMENT AS ORIGINALLY REPORTED BELOW 2 THE WALT DISNEY CO (DIS) CashFlowFlag INCOME STATEMENT 3 Fiscal year ends in September. USD in millions except per share 2017-09 4 Revenue 5 Cost of revenue 6 Gross profit 7 Operating expenses 8 Sales, General and administrative 9 Restructuring, merger and acquisition 0 Other operating expenses 2018-09 55137 30306 24831 2019-09 59434 32726 26708 2020-09 69570 42018 27552 65388 43880 21508 8860 8176 -157 2939 11541 -3611 7771 12369 5735 30 2981 -390 11 Total operating expenses 2 Operating income B. Interest Expense 4 Other income (expense) 5 Income before taxes 16 Provision for income taxes 17 Net income from continuing operations 10958 13873 507 422 13788 4422 9366 11871 14837 682 574 14729 1663 13066 15701 11851 1246 3339 13944 3031 10913 17714 3794 1647 -3890 -1743 699 -2442 18 Net income from discontinuing ops 19 Other 671 -530 -32 -390 -386 -468 11054 8980 8980 12598 12598 -2864 -2864 11054 20 Net income 21 Net income available to common shareholders P2 Earnings per share 23 Basic 24.Diluted 5.73 5.69 8.4 8.35 6.68 S15A -1.58 158 23 Basic 5.73 8.4 6.68 -158 24 Diluted 5.69 8.36 6.64 -158 25 Weighted average shares outstanding 26 Basic 1568 1499 1656 1808 27 Diluted 1578 1507 1666 1808 28 EBITDA 17077 18422 19350 5249 29 30 31 INSERT BELOW DIS BALANCE SHEET AS ORIGINALLY STATED 32 THE WALT DISNEY CO (DIS) Cash Flow Flag BALANCE SHEET 33 Fiscal year ends in September. USD in millions except per share 2017-09 2018-09 2019-09 2020-09 34 Assets 35 Current assets 36 Cash 37 Cash and cash equivalents 4017 4150 5418 17914 38 Total cash 4017 4150 5418 17914 39 Receivables 8013 8268 12882 11299 40 Inventories 1373 1392 1649 1583 41 Prepaid expenses 1723 1790 4597 2171 42 Other current assets 763 1225 3578 2284 43 Total current assets 15889 16825 28124 35251 44 Non-current assets 45 Property, plant and equipment 46. Gross property, plant and equipment 57443 60304 64018 67595 47 Accumulated Depreciation -29037 -30764 -32415 -35517 48 Net property, plant and equipment 28406 29540 31603 32078 49 Equity and other investments 3202 2899 3224 3903 50 Goodwill 31426 31269 80293 77689 CONCI 1012 CA 80293 31426 6995 9871 79900 95789 31269 6812 11253 81773 98598 23215 27525 165860 193984 77689 19173 33455 166298 201549 6172 6490 2365 4568 19595 3790 6503 2976 4591 17860 8857 13778 3984 4722 31341 5711 12663 4138 4116 26628 50 Goodwill 51 Intangible assets 52 Other long-term assets 53 Total non-current assets 54 Total assets 55 Liabilities and stockholders' equity 56 Liabilities 57 Current liabilities 58 Short-term debt 59 Accounts payable 60 Accrued liabilities 61 Deferred revenues 62 Total current liabilities 63 Non-current liabilities 64 Long-term debt 65 Deferred taxes liabilities 66 Pensions and other benefits 67 Minority interest 68 Other long-term liabilities 69 Total non-current 70 Total liabilities 71 Stockholders' equity 72 Common stock 73 Retained earnings 74 Treasury stock 75 Accumulated other comprehensive income 76 Total stockholders' equity 17 Total liabilities and stockholders' equity 19119 4480 3281 3689 17084 3109 2712 4059 38129 7902 4783 5012 17940 73766 105107 52917 7288 6451 4680 20002 91338 117966 4310 34879 54474 5001 31965 49825 36779 53907 42494 -907 36248 72606 -64011 -3528 41315 95789 82679 -67588 -3097 48773 98598 54497 38315 -907 -8322 83583 201549 -6617 88877 193984 so Financial stmtillin nis TONI 2018-09 2019-09 2020-09 9366 2782 13066 3011 10913 4160 334 364 -1185 -5 -1180 682 12343 - 1573 393 -1360 -17 - 1343 758 14295 117 711 -6186 -223 -5963 -3109 6606 -2442 5345 4953 -920 -392 525 -645 14 -659 1194 7618 30 THE WALT DISNEY CO (DIS) Statement of CASH FLOW 81 Fiscal year ends in September. USD in millions except per share 2017-09 82 Cash Flows From Operating Activities 83 Net income 84 Depreciation & amortization 85 Investment/asset impairment charges 86 Investments losses (gains) 87 Deferred income taxes 88 Stock based compensation 89 Change in working capital 90 Inventory 91 Other working capital 92 Other non-cash items 93 Net cash provided by operating activities 94 Cash Flows From Investing Activities 95 Investments in property, plant, and equipment 96 Acquisitions, net 97 Other investing activities 98 Net cash used for investing activities 99 Cash Flows From Financing Activities 100 Debt issued 101 Debt repayment 102 Common stock repurchased 103 Dividend paid 104 Other financing activities 105 Net cash provided by (used for) financing activities 106 Effect of exchange rate changes 107 Net change in cash -4022 -3623 -417 1-71 -4111 -4465 -1581 710 -5336 -4876 -9901 10659 -4118 385 -3637 38240 -38881 18120 -3533 4820 -2364 -9368 -2445 398 1056 -1871 -3577 -2515 -1936 -8843 -25 91 AOC -8959 31 -696 ACA -2895 2446 -1090 -98 1300 - 1587 -4520 8480 38 12499 ALLE 390 -8959 8480 31 -696 4760 4064 -8843 -25 91 4064 -1090 -98 1300 4155 5455 38 12499 5455 17954 4155 104 Other inancing 105 Net cash provided by (used for) financing activities 106 Effect of exchange rate changes 107 Net change in cash 108 Cash at beginning of period 109 Cash at end of period 110 Free Cash Flow 111 Operating cash flow 112 Capital expenditure 113 Free cash flow 114 115 116 117 118 14295 12343 -3623 8720 -4465 9830 6606 -4876 1730 7618 -4022 3596 119 120 121 Ratios 04 Dec-17 Dec-18 Dec-19 Dec-20 Industry Stock Price EBITDA Total Debt EPS Valuation Price-Earnings N/A Use diluted earnings Market to Book N/A Use Basic Shares (WASO) Enterprise/EBITDA Profitability Operating Margin Gross Profit Margin N/A Net Profit Margin N/A Return on Equity N/A Based on Total Equity to Parent Shareholders N/A Profitability Operating Margin Gross Profit Margin Net Profit Margin N/A Return on Equity Based on Total Equity to Parent Shareholders N/A Financial Strength Current Ratio N/A N/A Book Debt-Equity Mkt Debt-Equity Interest Coverage N/A Enterprise Value
Step by Step Solution
There are 3 Steps involved in it

Get step-by-step solutions from verified subject matter experts