

Question: Using the Financial Statements from Boursa Kuwait website, show your full input, calculation, and interpretation of the ratio in the table below Profitability Ratios Ratio
Using the Financial Statements from Boursa Kuwait website, show your full input, calculation, and interpretation of the ratio in the table below
Profitability Ratios | Ratio Calculation | Ratio Interpretation | |
Profit margin | Net income Net Sales (or net revenues) | ||
Asset turnover | Net sales (or net revenues) Average Assets Average assets can be calculated by using total assets value at the end of the current year plus total assets value at the end of the previous year and then divide the result by two. | ||
Return on Assets | Net income Average Assets | ||
Liquidity Ratios | Ratio Calculation | Ratio Interpretation | |
Current Ratio | Current Assets Current Liabilities | ||
Quick Ratio | Cash +marketable securities + Receivables Current Liabilities | ||
Debt Ratio | Total Liabilities Total Assets | ||
Download the most recent financial statements (2021) of SULTAN CENTER FOOD PRODUCTS COMPANY - K.S.C from Boursa of Kuwait.
Use the following statements:
1. Consolidated Statement of financial position (page 5)
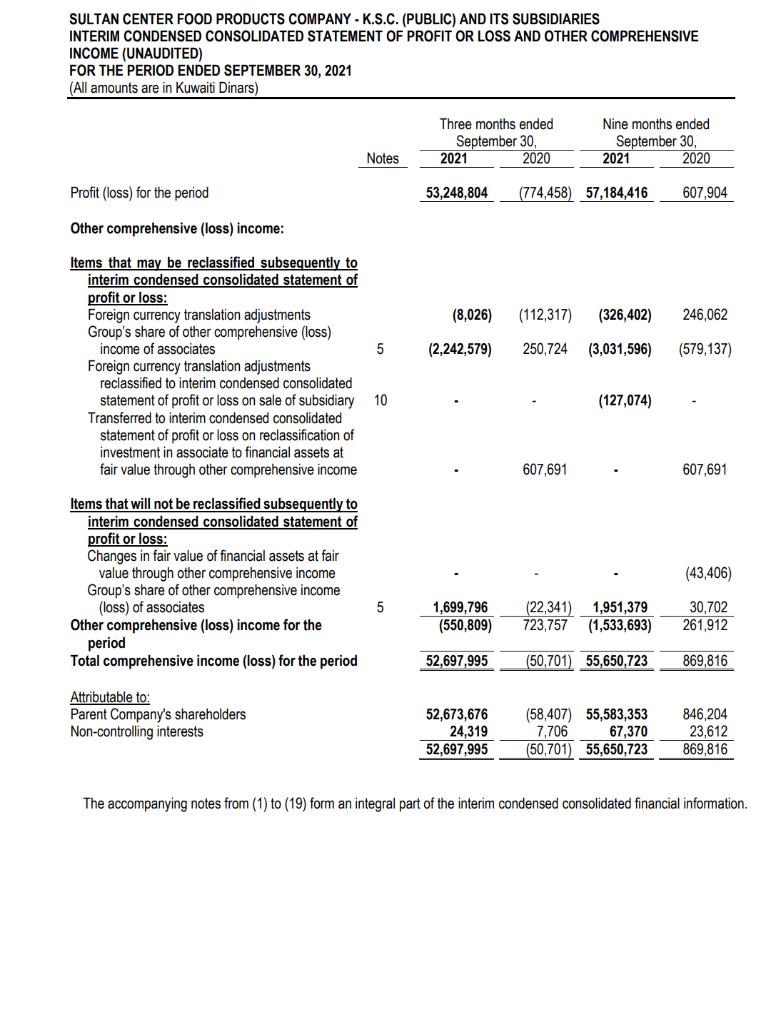
2. Consolidated statement of comprehensive income (page 6)
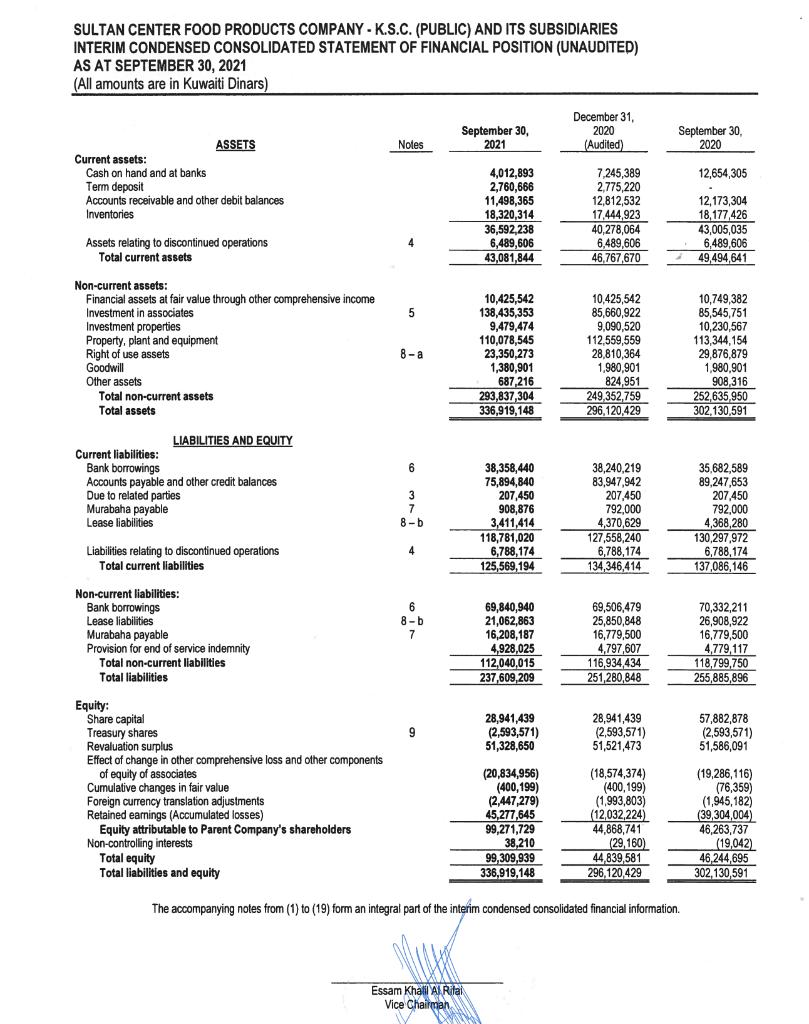
SULTAN CENTER FOOD PRODUCTS COMPANY - K.S.C. (PUBLIC) AND ITS SUBSIDIARIES INTERIM CONDENSED CONSOLIDATED STATEMENT OF FINANCIAL POSITION (UNAUDITED) AS AT SEPTEMBER 30, 2021 (All amounts are in Kuwaiti Dinars) Current assets: Cash on hand and at banks. Term deposit Accounts receivable and other debit balances Inventories Assets relating to discontinued operations Total current assets Non-current assets: Financial assets at fair value through other comprehensive income Investment in associates ASSETS Investment properties Property, plant and equipment Right of use assets Goodwill Other assets Total non-current assets Total assets Current liabilities: Bank borrowings LIABILITIES AND EQUITY Accounts payable and other credit balances Due to related parties Murabaha payable Lease liabilities Liabilities relating to discontinued operations Total current liabilities Non-current liabilities: Bank borrowings Lease liabilities Equity: Murabaha payable Provision for end of service indemnity Total non-current liabilities Total liabilities Share capital Treasury shares Revaluation surplus Effect of change in other comprehensive loss and other components of equity of associates Cumulative changes in fair value Foreign currency translation adjustments Retained earnings (Accumulated losses) Equity attributable to Parent Company's shareholders Non-controlling interests Notes 4 5 8-a 6 3 7 8-b 4 6 8-b 7 9 September 30, 2021 4,012,893 2,760,666 11,498,365 18,320,314 Essam Khalil AlRital Vice Chairman 36,592,238 6,489,606 43,081,844 10,425,542 138,435,353 9.479.474 110,078,545 23,350,273 1,380,901 687,216 293,837,304 336,919,148 38,358,440 75,894,840 207,450 908,876 3,411,414 118,781,020 6,788,174 125,569,194 69,840,940 21,062,863 16,208,187 4,928,025 112,040,015 237,609,209 28,941,439 (2,593,571) 51,328,650 (20,834,956) (400,199) (2,447,279) 45,277,645 99,271,729 38,210 99,309,939 336,919,148 December 31, 2020 (Audited) 7,245,389 2,775,220 12,812,532 17,444,923 40,278,064 6,489,606 46,767,670 10,425,542 85,660,922 9,090,520 112,559,559 28,810,364 1,980,901 824,951 249,352,759 296,120,429 38,240,219 83,947,942 207,450 792,000 4,370,629 127,558,240 6,788,174 134,346,414 69,506,479 25,850,848 16,779,500 4,797,607 116,934,434 251,280,848 28,941,439 (2,593,571) 51,521,473 (18,574,374) (400,199) (1,993,803) (12,032,224) 44,868,741 (29,160) Total equity Total liabilities and equity The accompanying notes from (1) to (19) form an integral part of the interim condensed consolidated financial information. 44,839,581 296,120,429 September 30, 2020 12,654,305 12,173,304 18,177,426 43.005.035 6,489,606 49,494,641 10,749,382 85,545,751 10,230,567 113,344,154 29,876,879 1,980,901 908,316 252,635,950 302,130,591 35,682,589 89,247,653 207,450 792,000 4,368,280 130,297,972 6,788,174 137,086,146 70,332,211 26,908,922 16,779,500 4,779,117 118,799,750 255,885,896 57,882,878 (2,593,571) 51,586,091 (19,286,116) (76,359) (1,945,182) (39,304,004) 46,263,737 (19,042) 46,244,695 302,130,591
Step by Step Solution
3.48 Rating (164 Votes )
There are 3 Steps involved in it
Profitability analysis This analysis is used to assess profitability of ... View full answer

Get step-by-step solutions from verified subject matter experts