

Question: Using the following data and p5js to draw a pie chart about favorite types of movie. Type Comedy Action Romance Drama SciFi Count 4
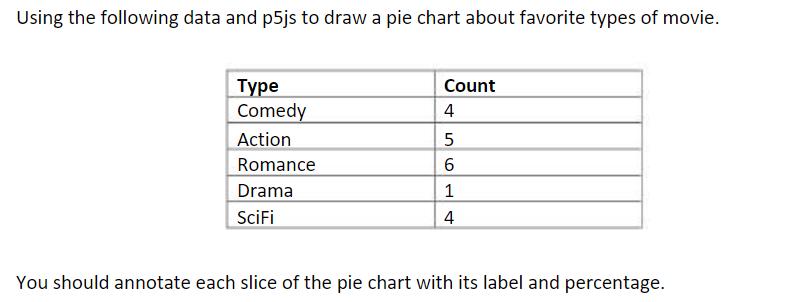
Using the following data and p5js to draw a pie chart about favorite types of movie. Type Comedy Action Romance Drama SciFi Count 4 5 561 4 You should annotate each slice of the pie chart with its label and percentage.
Step by Step Solution
There are 3 Steps involved in it
1 Expert Approved Answer
Step: 1 Unlock

Solution Define the data for the pie chart let data 4 5 6 1 4 Count of each type of movie let labels Comedy Action Romance Drama SciFi Labels for each ... View full answer
Question Has Been Solved by an Expert!
Get step-by-step solutions from verified subject matter experts
Step: 2 Unlock
Step: 3 Unlock